Report with Dashboards
Business intelligence,
but dead easy
Report with Dashboards
Instantly turn spreadsheets into dashboards and auto-distribute up-to-date reports – all in a few clicks.
Trusted by teams like...
If only business intelligence were this intuitive
Create with ease
If you can create a spreadsheet, you can create a dashboard.
Update on the fly
Make changes with zero dependencies on data science or engineering.
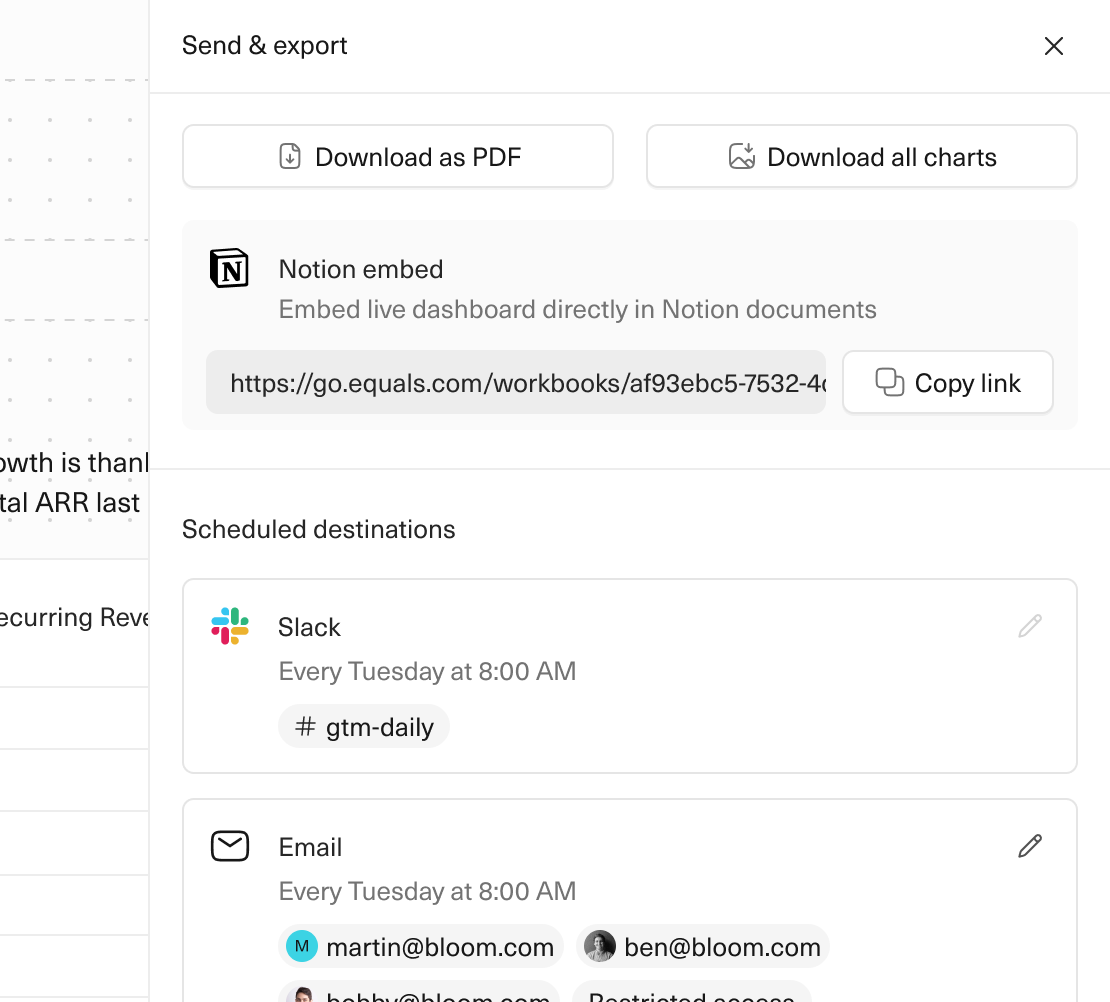
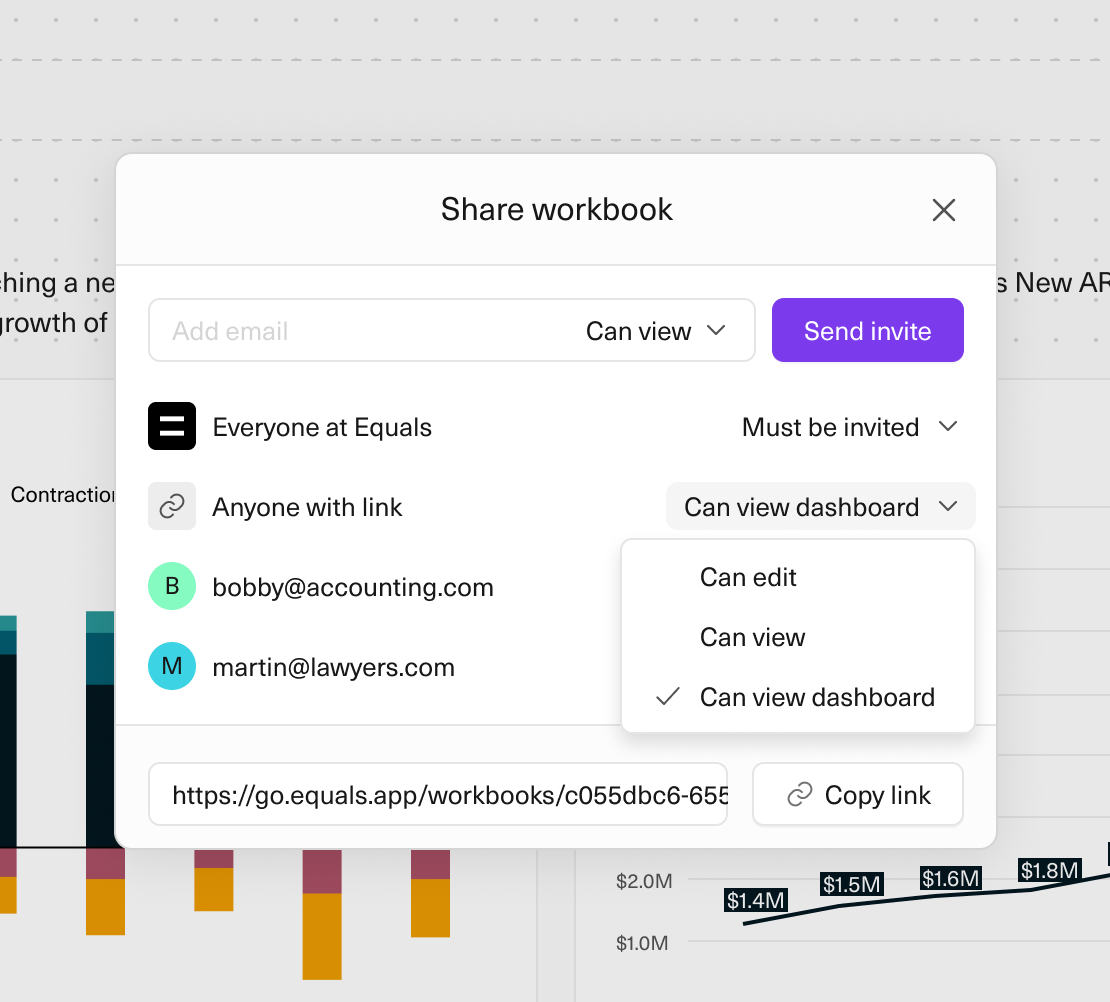
Distribute automatically
Schedule reports to update and send to Slack or email — daily or weekly.
Use one tool, not three
Data connections, a full-featured spreadsheet, and dashboards — all-in-one.
Put your reporting on autopilot
“The fact that the data syncs without having to touch anything is so nice. I just know that our CEO's not going to go in and see stale data.”

Manaan Alexander
Operations Lead, CommandAI
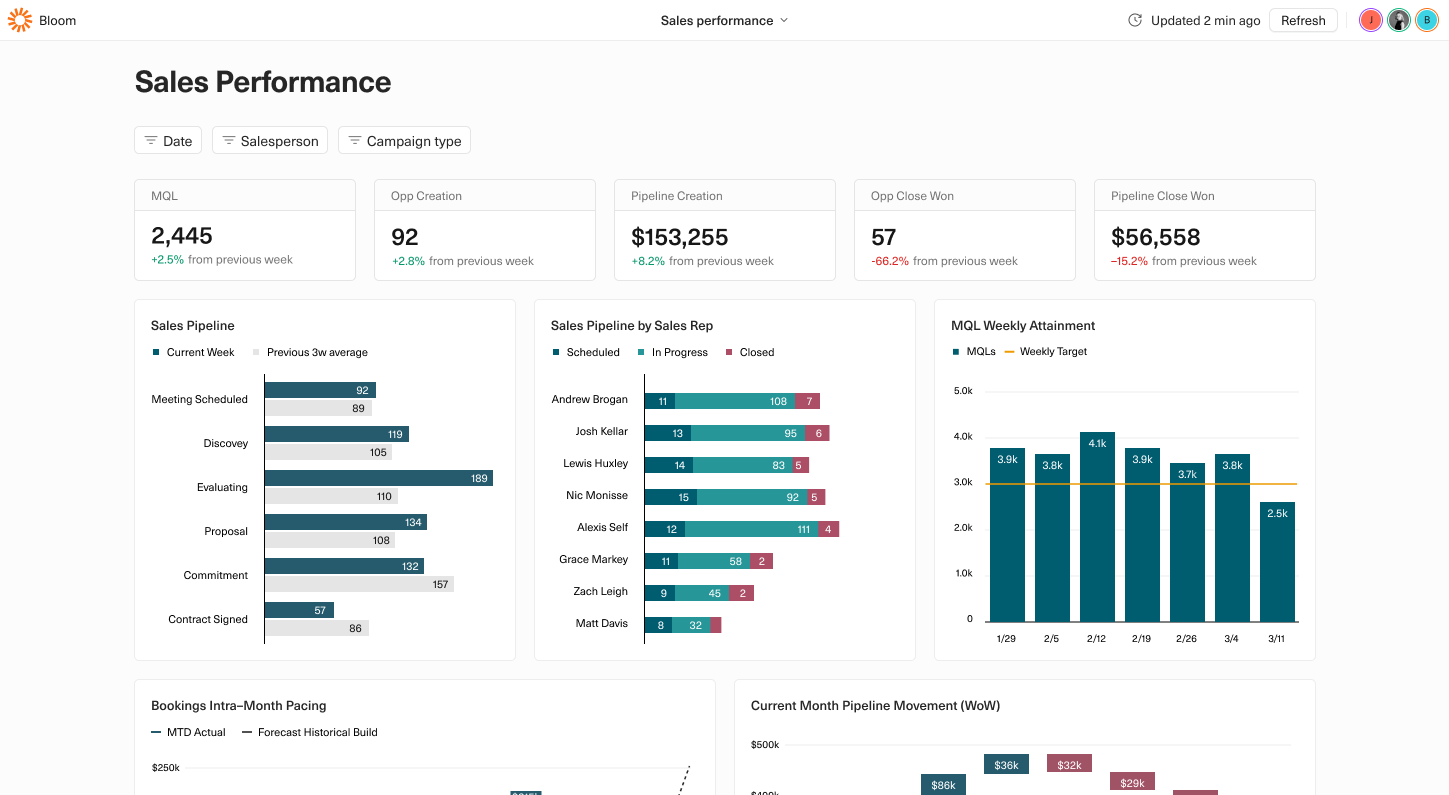
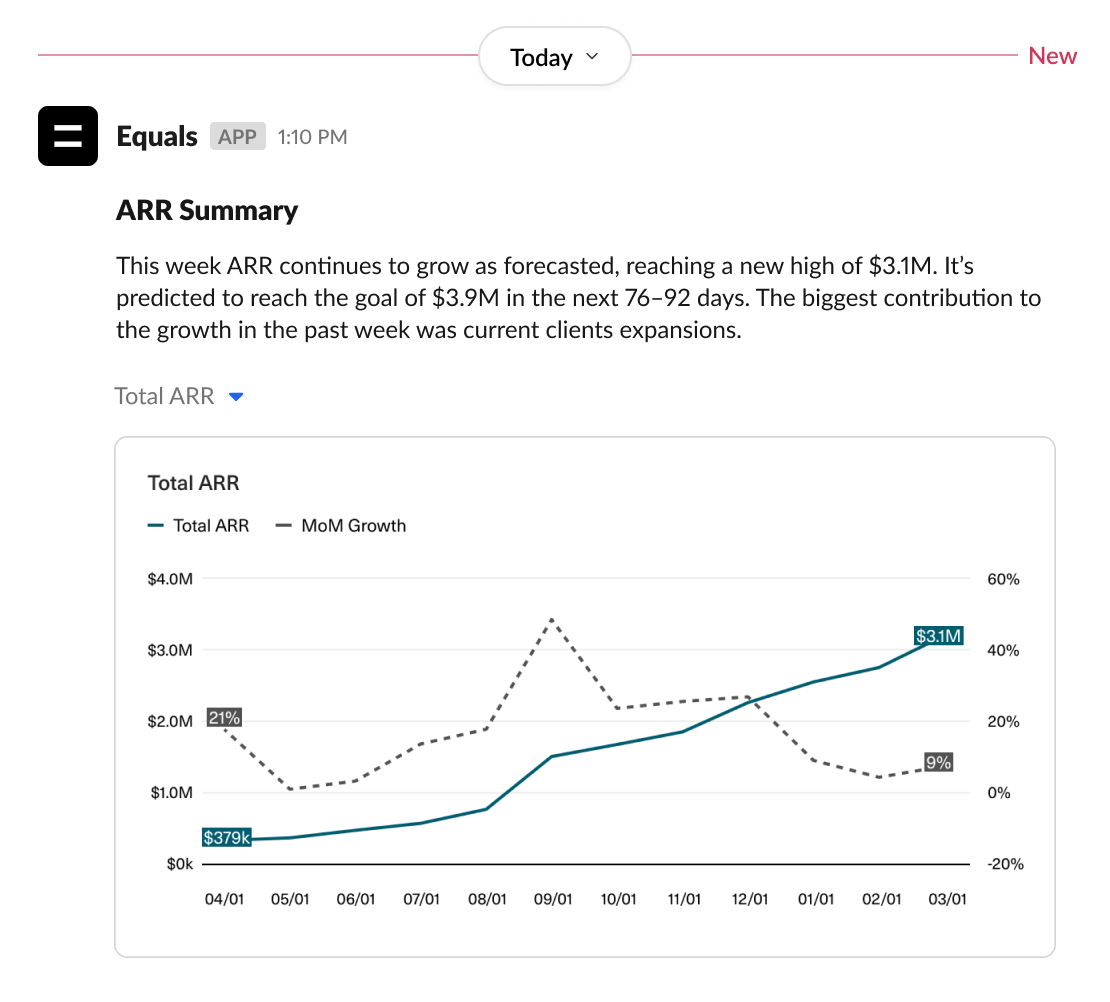
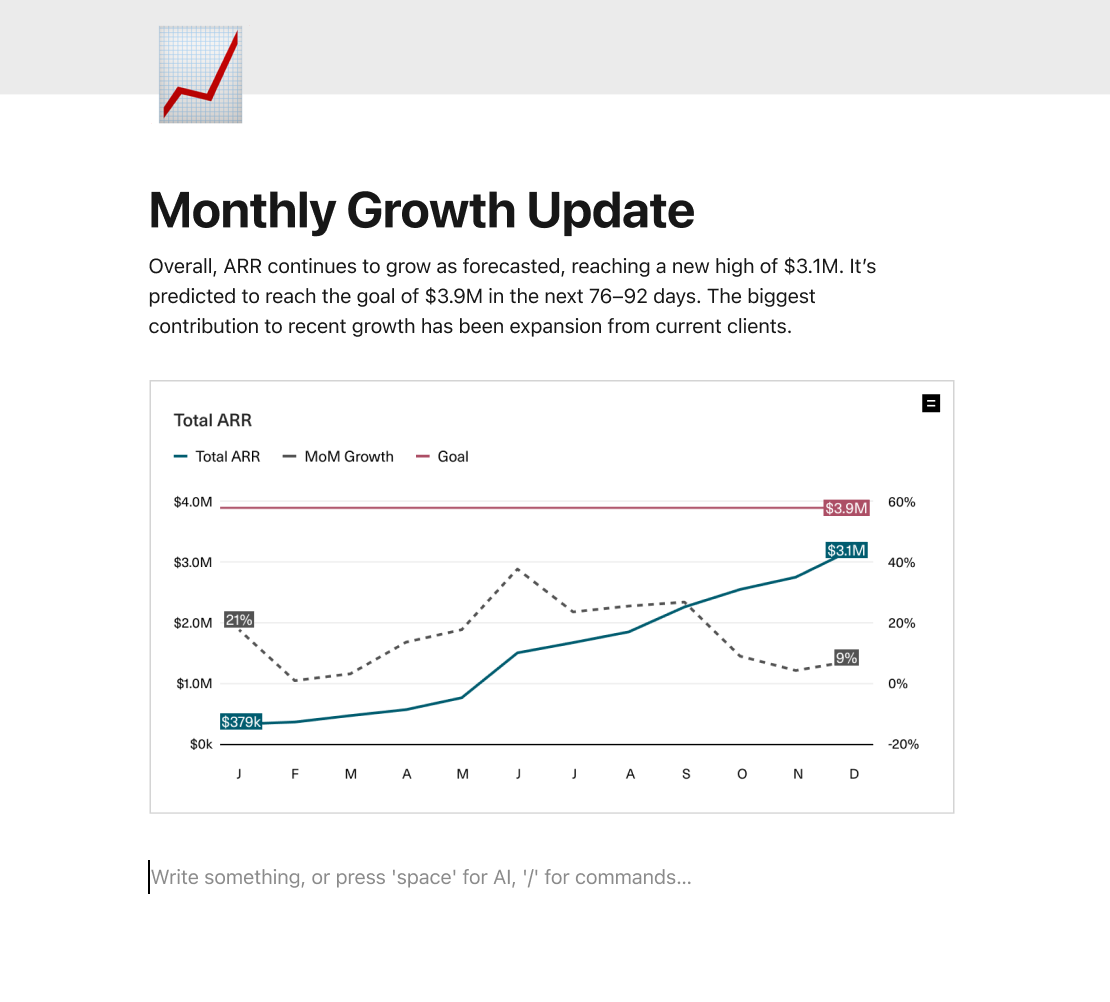
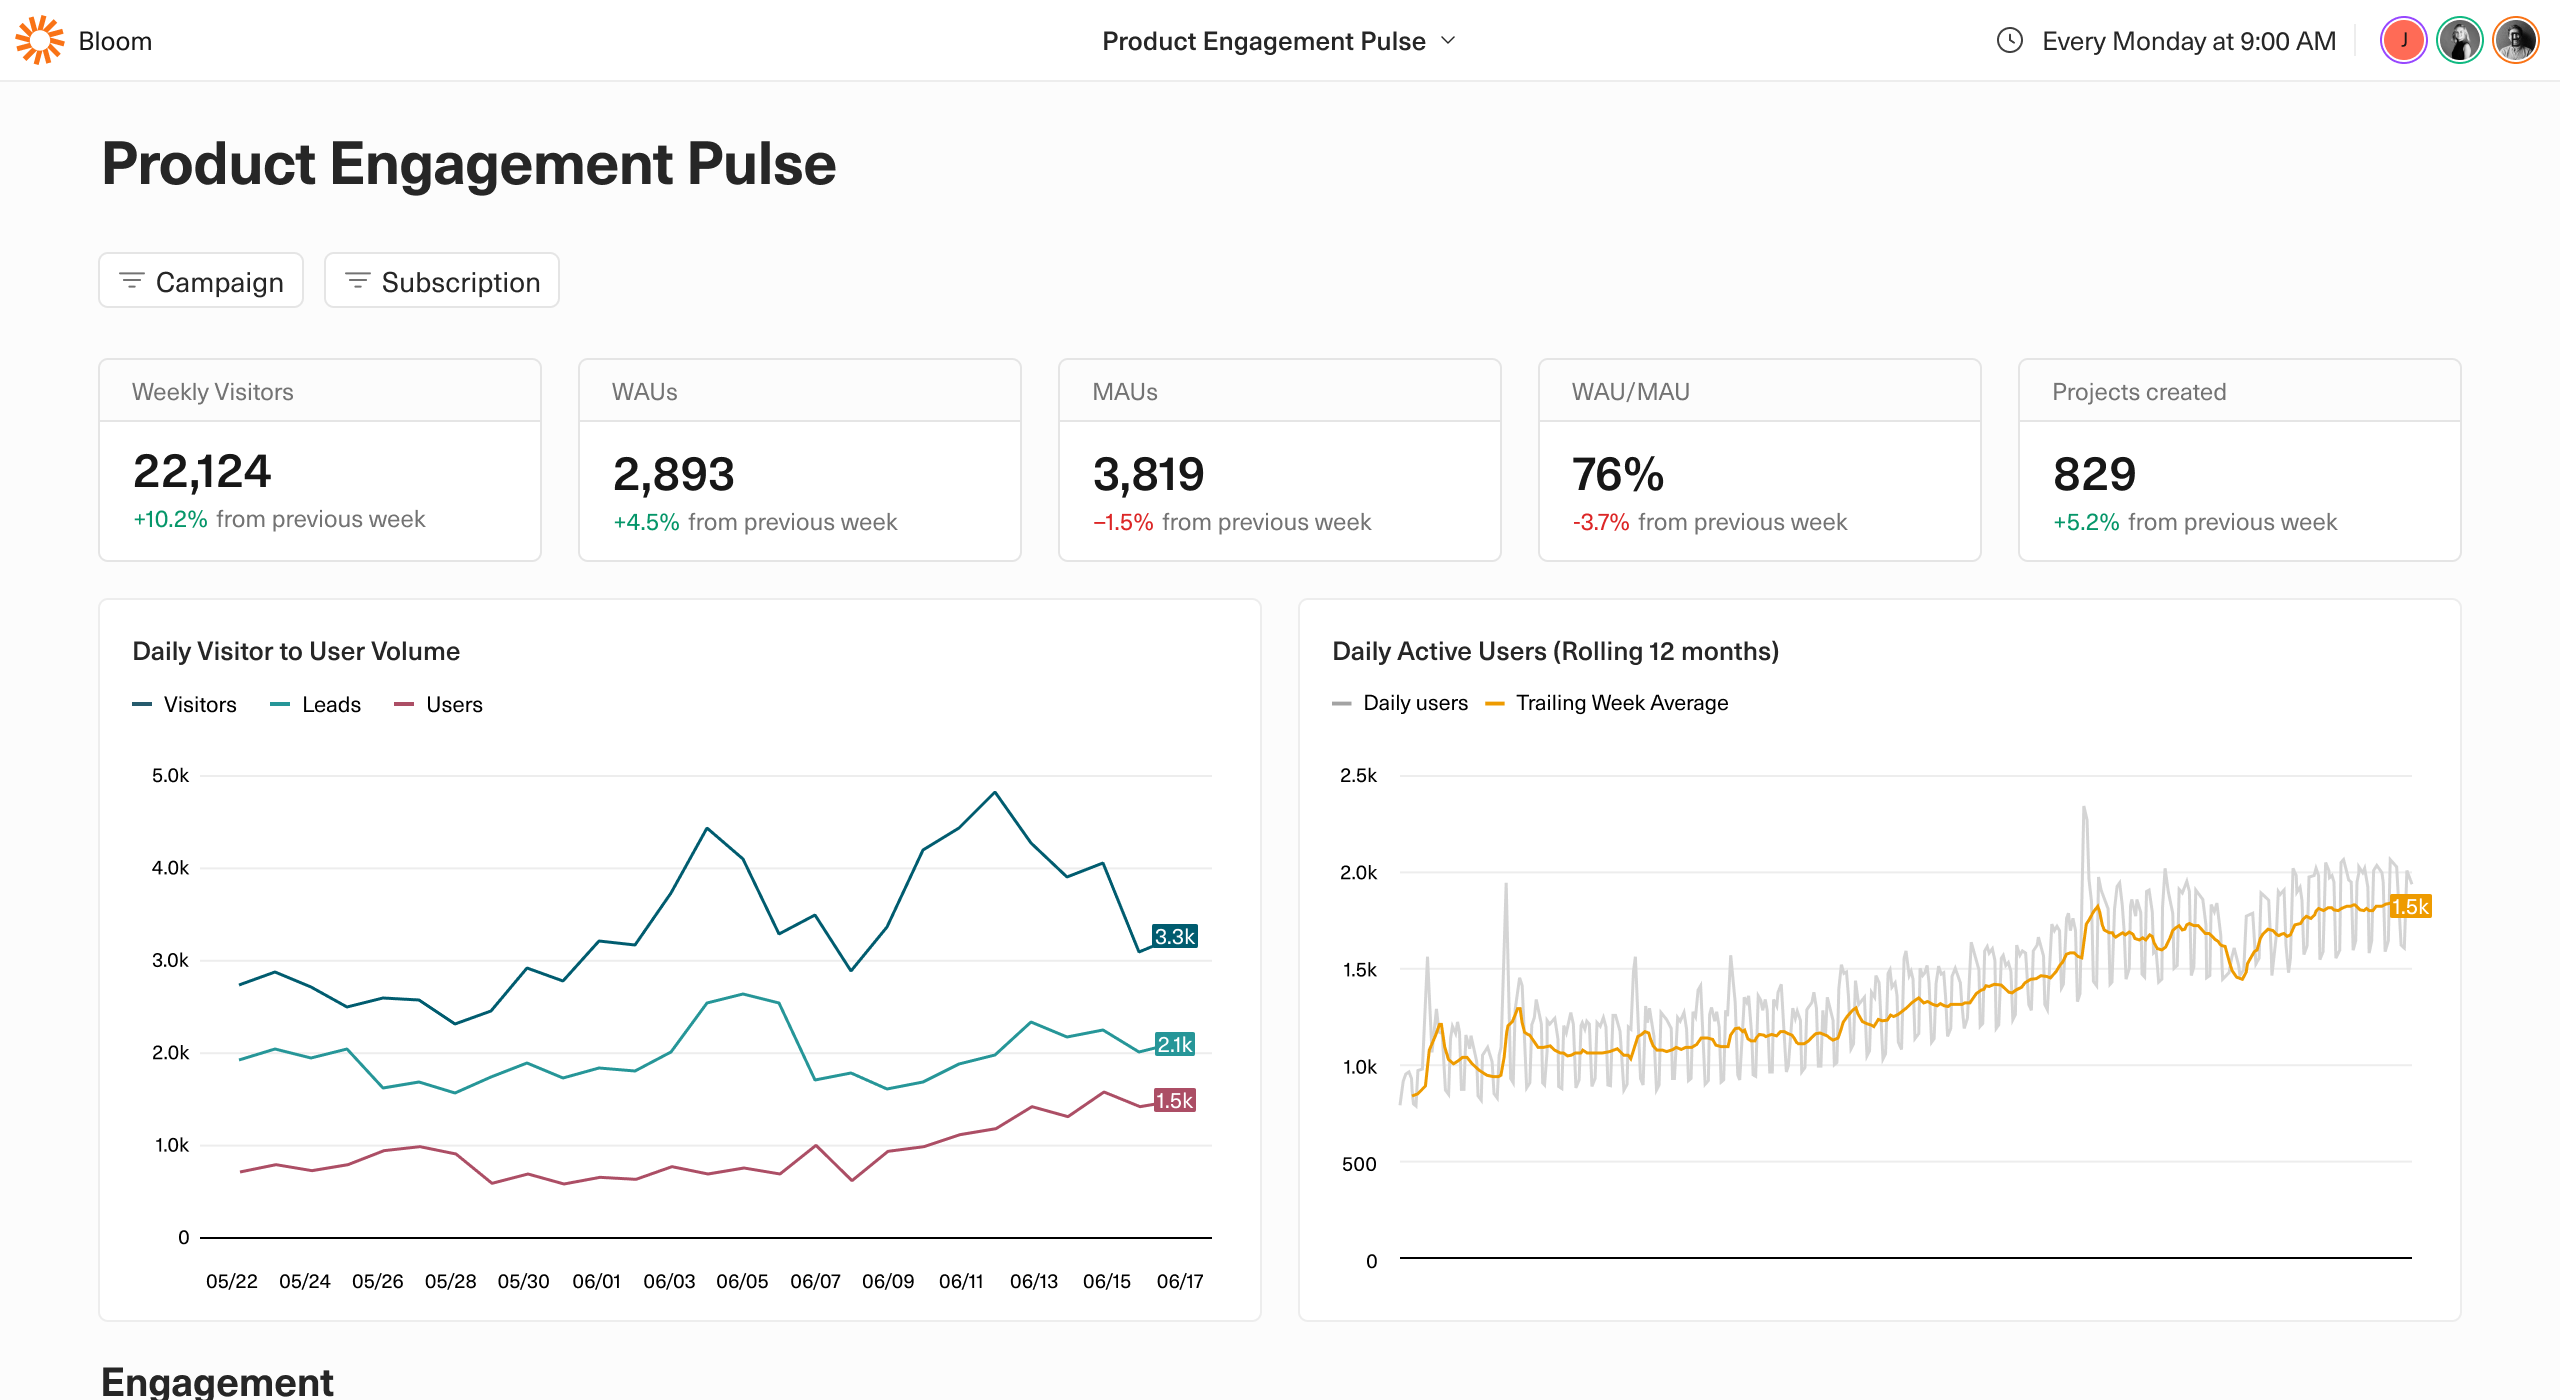
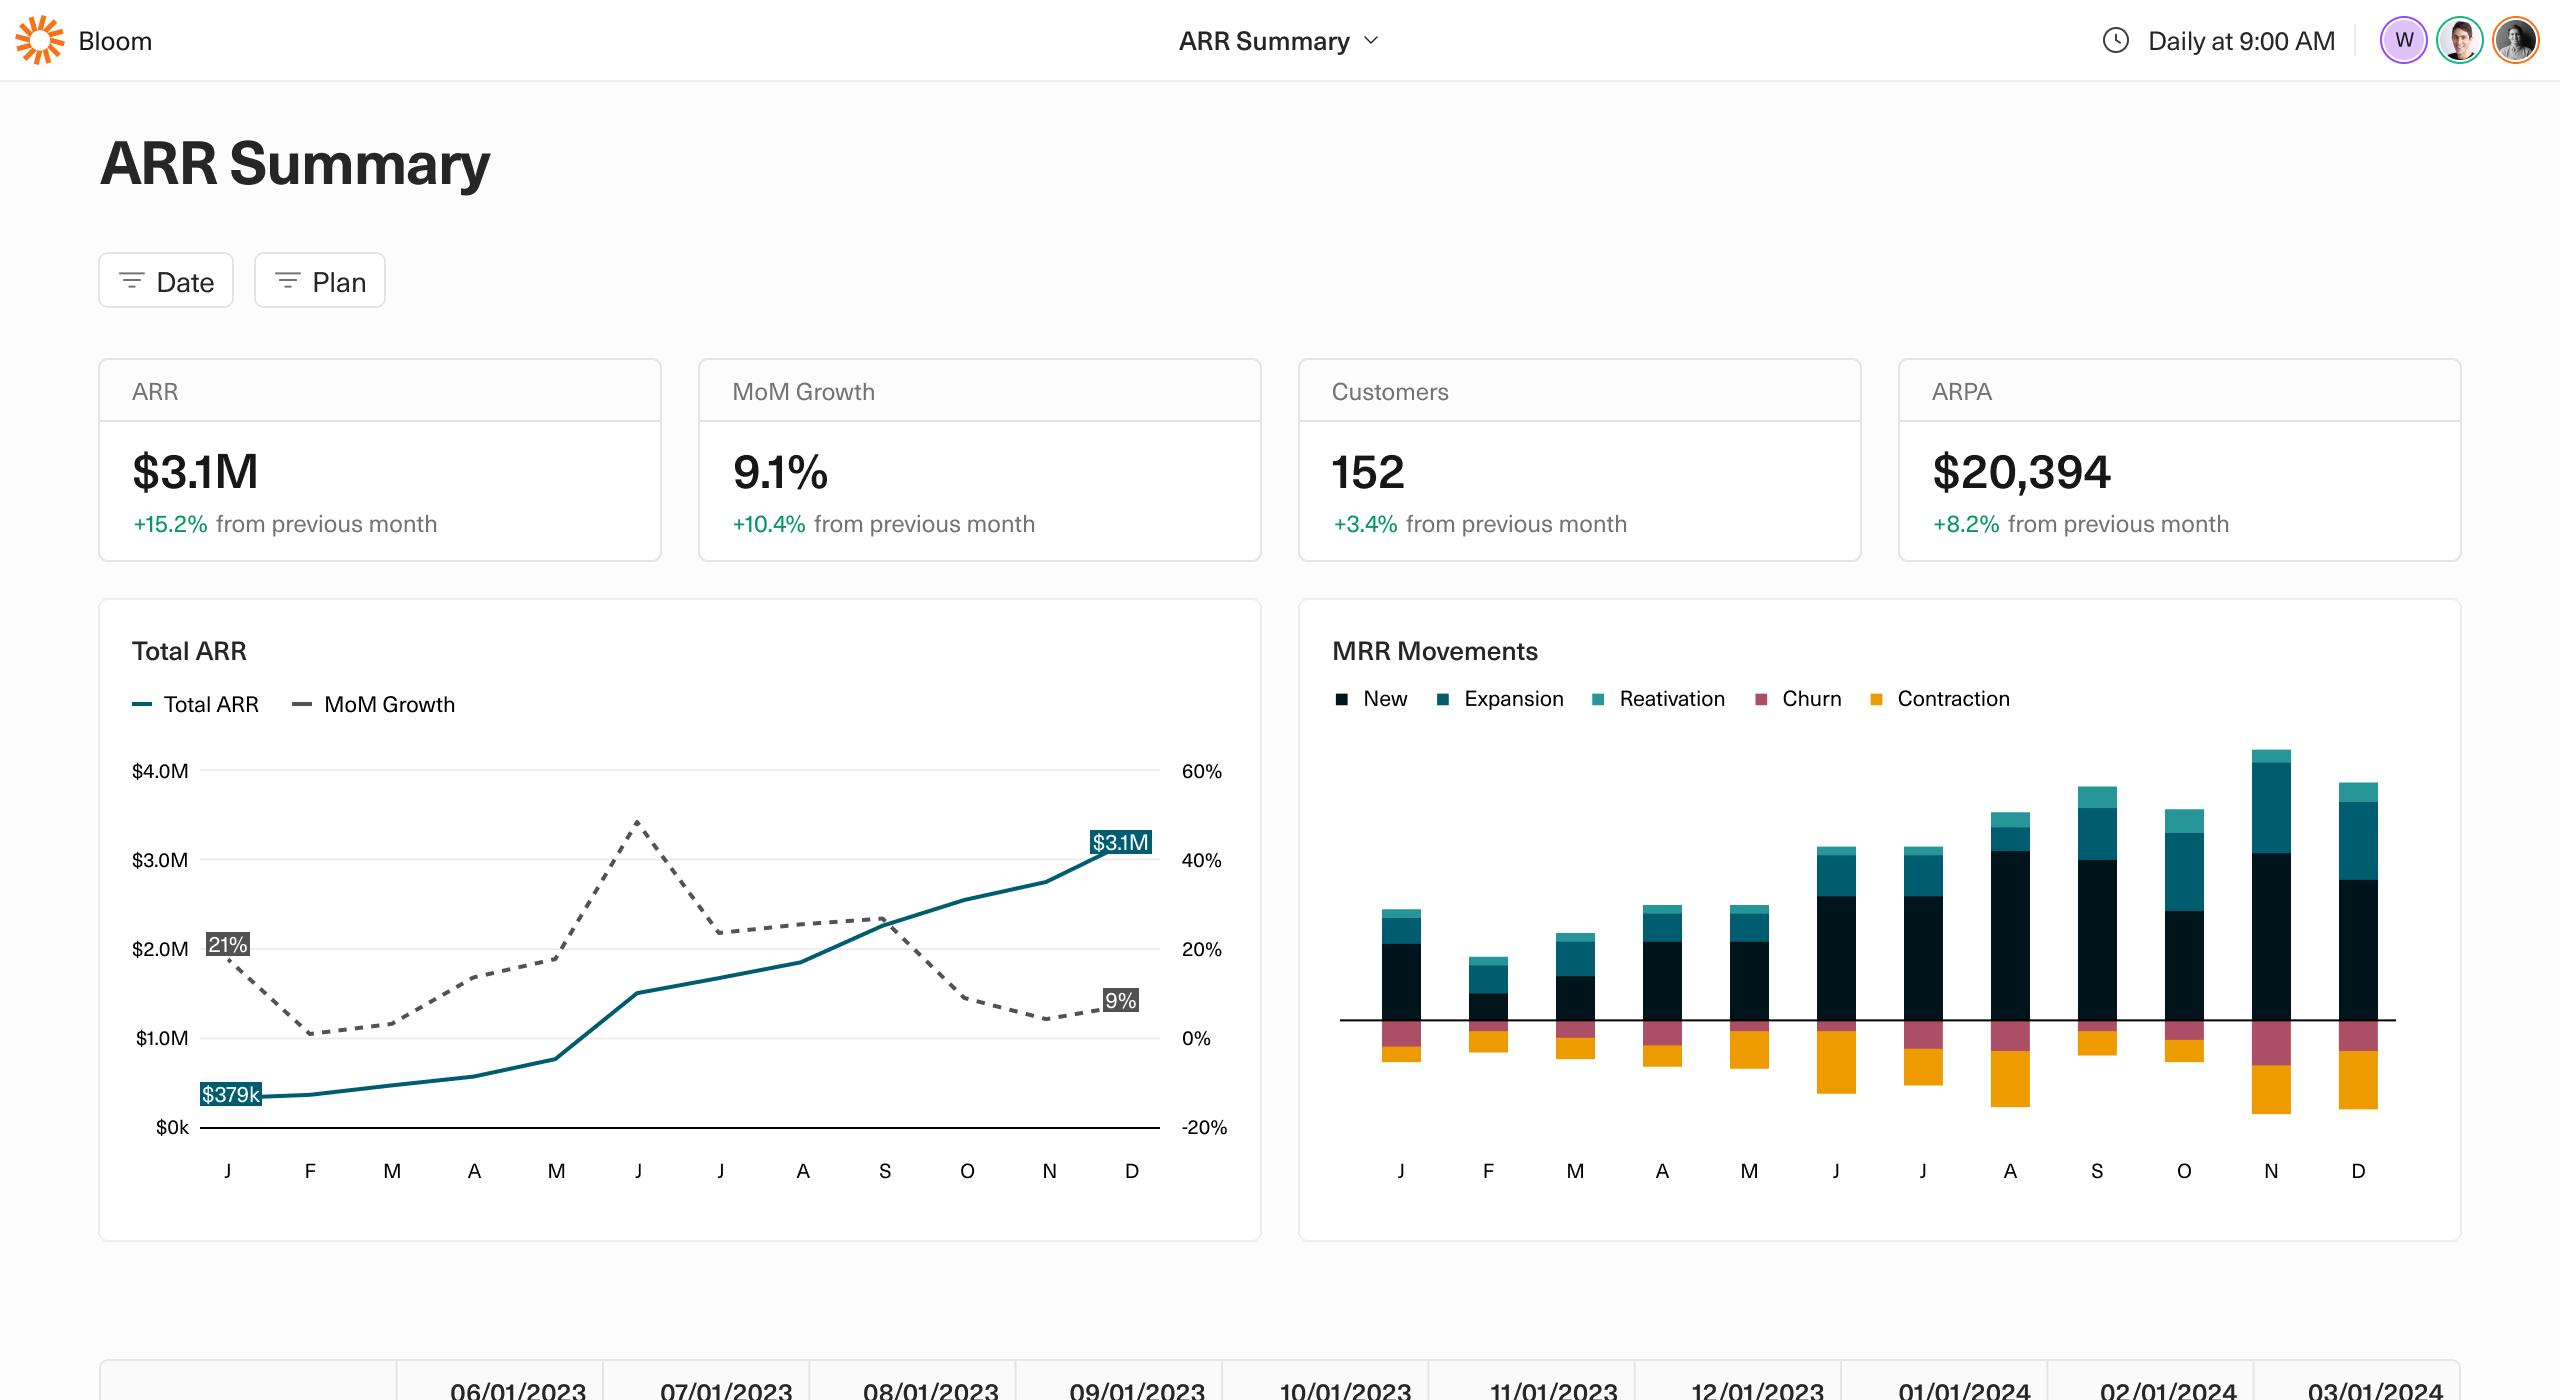
If you can spreadsheet, you can dashboard
Here are a few dashboards we prepared earlier.

Making business intelligence
dead easy for everyone
-
“Equals has already been a game changer for me. With dashboards, I can easily share insights across our entire team in a scaleable and automated way.”

Jared Kaufman
Chief of Staff, Pocus -
“Dashboards take Equals to the next level! The visualisation tools have been super helpful in getting the entire company on the same page.”

Bruno Haag
VP of Product, Komi -
“I love being able to set dashboards to update stakeholders, and not worrying about any changes being made to the analysis is a game changer.”

Theo Blanchard
Senior Finance Manager, Sunsave -
“Pushing our dashboards into Slack has ensured that our data is always handy. Dashboards keep us aligned and working towards a common goal.”

Evan Noll
VP of Growth, BoomPop -
“Equals solves 90% of the things that annoyed us about Excel and BI tools, while being incredibly intuitive. If you’ve ever used a spreadsheet you'll get value on day one.”

Kyle Hubner
Rev Ops, Thought Industries -
“I can finally automate reporting across any data source with the precision and flexibility that I could previously only get from Excel – I wish I had this years ago!”

Jessiah Straw
AVP, Merit Holdings