Waterfall charts are the clearest way to show how incremental changes produce a net effect on a metric, like revenue. Now you can easily make them in Equals.
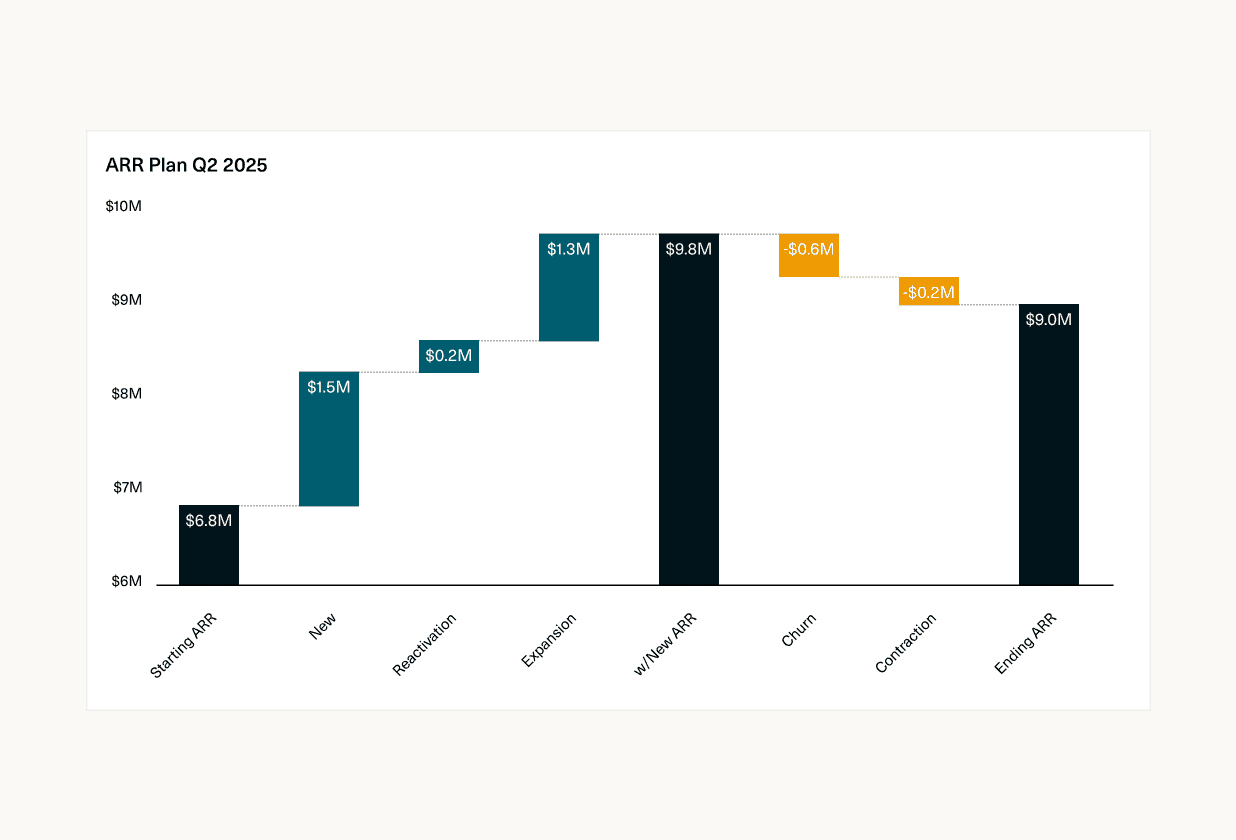
Waterfall charts
Designed and built by
 Robert Long
 Martin Rariga
Upgrade to real-time insights.
Guide your team with next-level clarity on pipeline coverage and funnel conversion.