Go from raw data to chart with just a few clicks.
Date aggregations: group raw data by week/month/year, without creating an intermediary table.
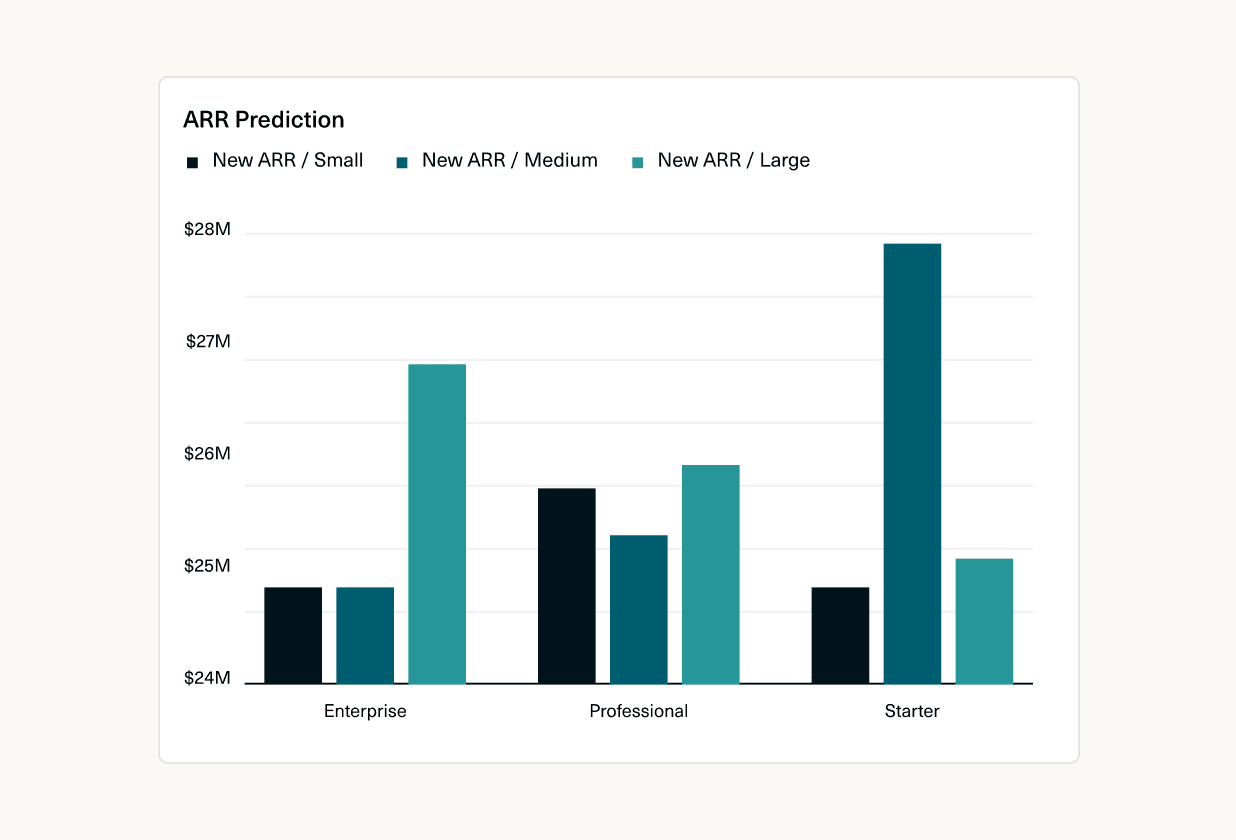
Breakdowns: group a series by another series (‘Lost ARR’ by ‘team size’), without an intermediary table.
These subtle changes mean you can create almost any chart directly from data.
 Robert Long
 Martin Rariga