The Guide to
SaaS Metrics
The Guide to
SaaS Metrics
Table of Contents
Engagement metrics
What are they?
Engagement metrics consider the degree to which customers return to your product, how often they use it, and how deeply they use it. High engagement indicates that customers interact with your product consistently and frequently, suggesting that they find value in it. In this way, engagement is a leading indicator of retention and conversion to paid.
The smartest investors know that deep engagement and a large total addressable market are the makings of something potentially really special. The opposite is also true — strong revenue numbers but weak engagement are a house of cards ready to come tumbling down.
The most widely used engagement metrics include Daily Active Users (DAU), Weekly Active Users (WAU), and Monthly Active Users (MAU). These track the number of unique users engaging with your product within the specified timeframes.
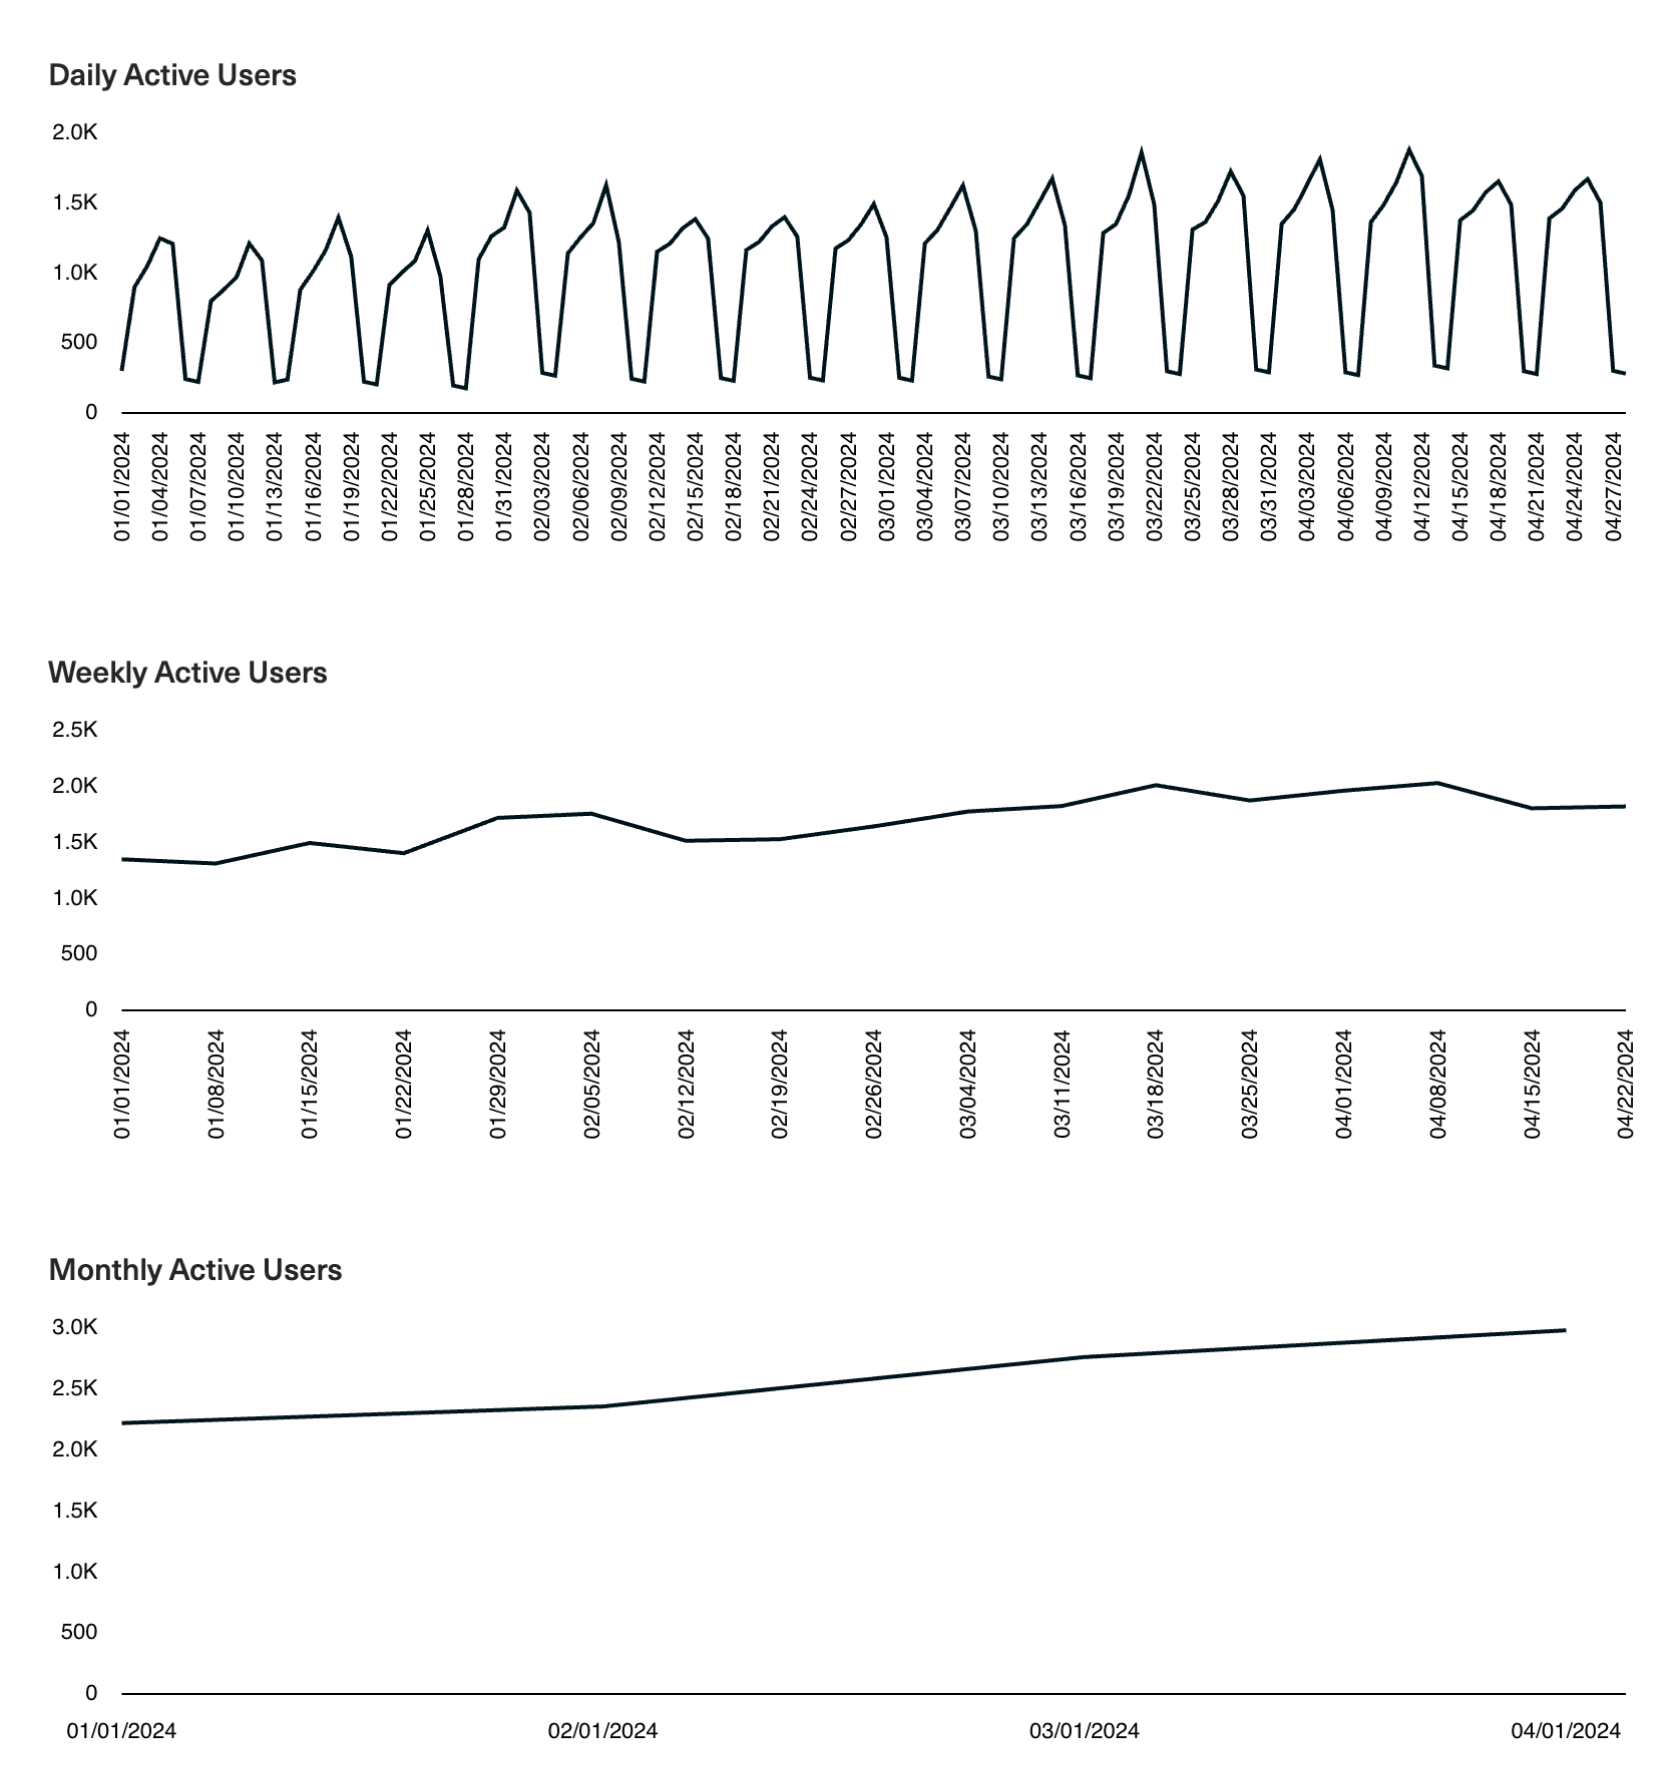
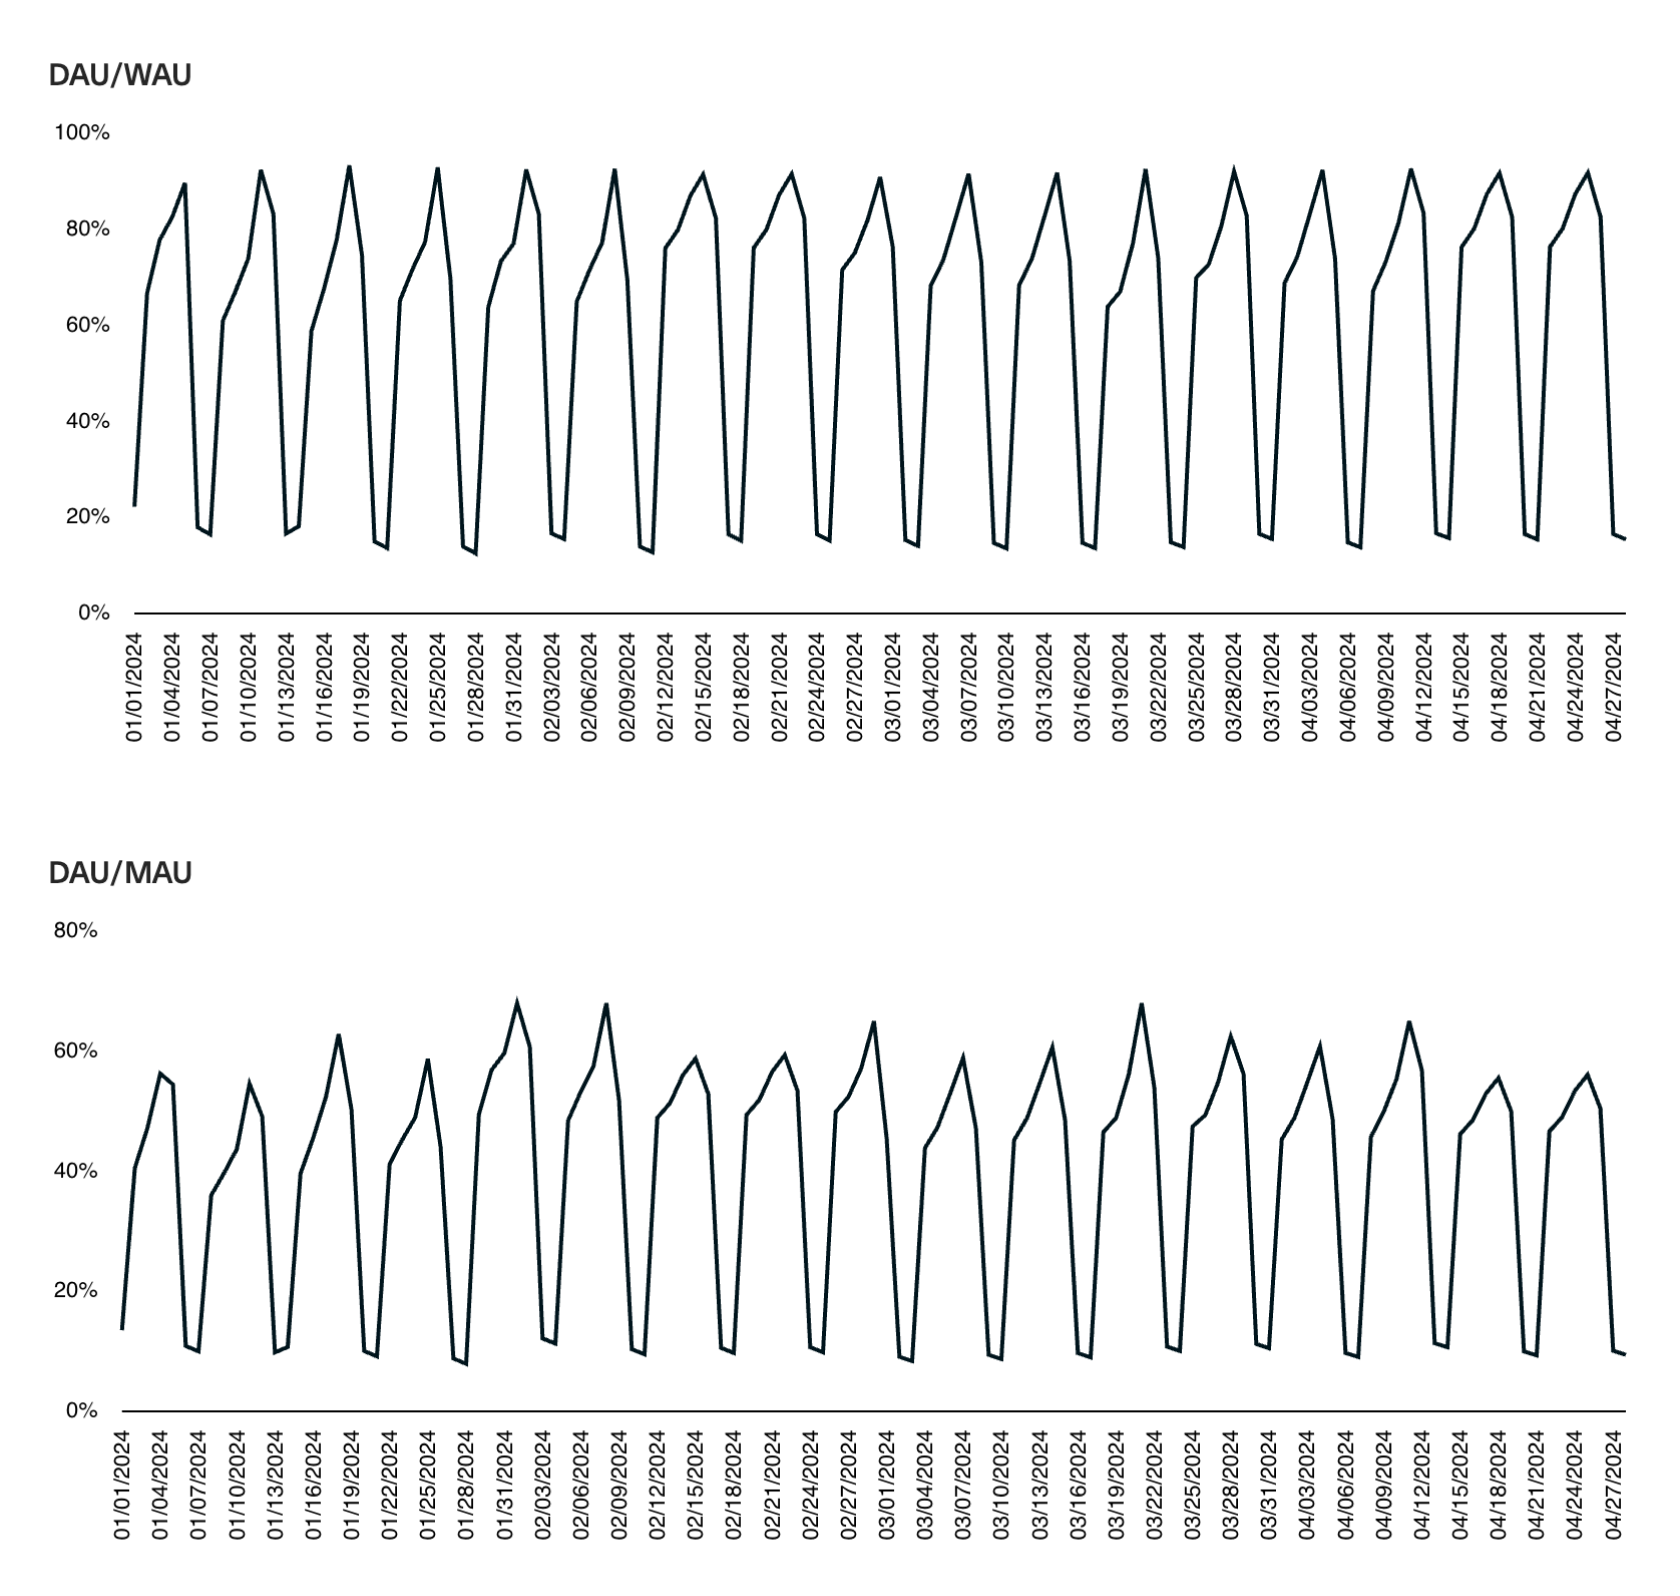
When interpreting engagement metrics, you’ll also want to consider the ratios of your Daily to Weekly Active Users (DAU:WAU) and Daily to Monthly Active Users (DAU:MAU).
These measure how consistently users interact with your product within the given timeframe. For example, a DAU:WAU of 1.0 means that all your WAUs are active daily and return to your product every day of the week. A DAU:MAU of 0.5 is generally considered the gold standard, indicating that about half of your MAUs are active daily. Investors would call this a “daily habit” (of the good kind).
However, remember that it’s crucial to tailor these metrics to your business model and how users derive value from your product. For example, Instagram would expect a high DAU:MAU ratio because users can only derive value by logging in to check their feeds. By contrast, it would be unfair to expect a 0.5 DAU:MAU ratio from a company like TurboTax because users only need to engage once during tax season to derive value from TurboTax for the entire year (phew!).
You must account for your product’s usage patterns to tailor engagement metrics to your business model. For B2B SaaS products, remember that users typically only engage on business days, meaning you’ll want to look at “workday peaks” in engagement rather than overall averages. On the other hand, Freemium products should distinguish between free and paid user engagement and consider removing free users from the analysis as they tend to skew metrics downward.
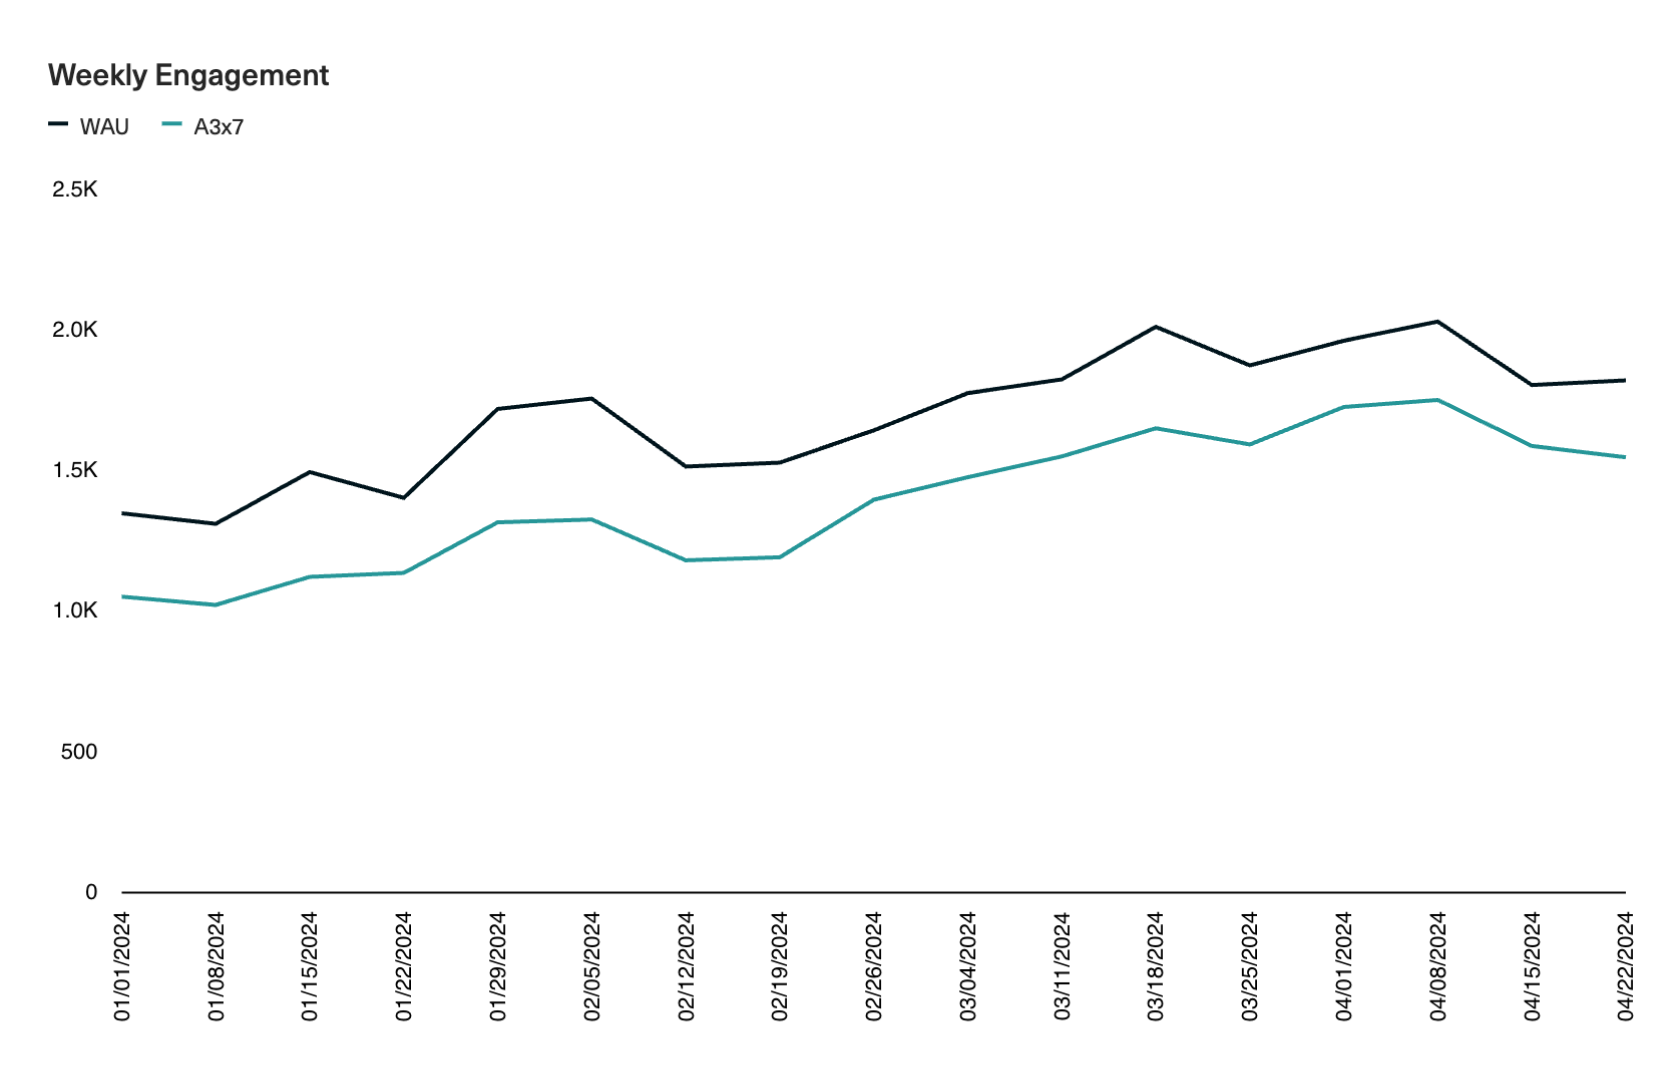
At Equals, we prefer using more robust engagement metrics like A3×7. This is a measure of everyone who is returning to your product three or more times a week. It’s a higher bar for measuring engagement and, as a result, tends to be less spiky with a higher signal-to-noise ratio. It’s also more difficult to game — while you can easily spike WAUs by sending a newsletter, boosting A3×7 with any single tactic is hard.
How to calculate engagement metrics
Calculating engagement metrics is a relatively straightforward process that involves counting the number of unique users who engage with your product within the specified timeframe (e.g., day/week/month).
You’ll first need to determine what constitutes an “active” user for your product. This could be defined by a login event, completing a key action in the product (typically one that is correlated with the “aha!” moment or the key mechanism by which your product delivers value), or spending a certain amount of time in the app (which controls for users who log in but quickly bounce).
You’ll then need to assign each user a unique identifier and record their interactions with your product with timestamps.
Finally, count the unique users who engaged each day, week, or month as defined by your engagement criteria. Each user should only be counted once within a given timeframe, regardless of how many times they engaged.
How to optimize engagement
Promoting new features effectively is a powerful lever for boosting product engagement. In-app guidance, tutorials, and case studies showcasing the benefits can encourage discovery and adoption. Additionally, shipping features that are collaborative by nature can create a growth loop by which users invite others to join, organically expanding your user base and their engagement.
An effective onboarding process is also critical for setting users up for success and ensuring they can derive value from your product quickly. Take the time to assess your onboarding flow — are users getting stuck or dropping off at certain points? Are they failing to discover and adopt important features early in their lifecycle?
After onboarding, your customer success efforts become critical. Ensure that your Success team proactively reaches out to customers, assesses their evolving goals and challenges, and demonstrates how your product can help them achieve those goals. You can help existing customers get more value from your product by providing personalized support, training, and best practices.
Finally, your pricing model is a critical lever for driving engagement over the long term. Seat-based pricing models tend to limit engagement, incentivizing users to “gatekeep” the number of seats they pay for and capping the degree to which your product is distributed within a given company. By contrast, a usage-based model encourages companies to evangelize their product internally to get as many users as needed actively engaged. Because users only pay for what they use, this model aligns your success (generating revenue) with your customers’ (deriving value from your product). The challenge with pricing is that there’s no perfect pricing model for each business and market. You should test different pricing models to find what works best for your product at your stage in your market.