The Guide to
SaaS Metrics
The Guide to
SaaS Metrics
Table of Contents
- Introduction
- Metrics to Measure
- Operationalizing Metrics
- Visualizing Metrics
- Sharing Metrics with Your Board
- Fundraising with Metrics
- Good Luck Out There
- Appendix
Find the levers to grow faster →
GTM analytics that shows you what's working — and what's not.
Payback Period
- By
-
 Bobby Pinero
Bobby Pinero
Bobby Pinero
15+ years of corporate finance experience, currently co-founder at Equals and board member at Intercom.

What is Payback Period?
Payback Period is the time it takes for a business to recoup its upfront investment in acquiring a customer — in other words, it’s the time it takes to break even on CAC and exit the Triangle of Despair.
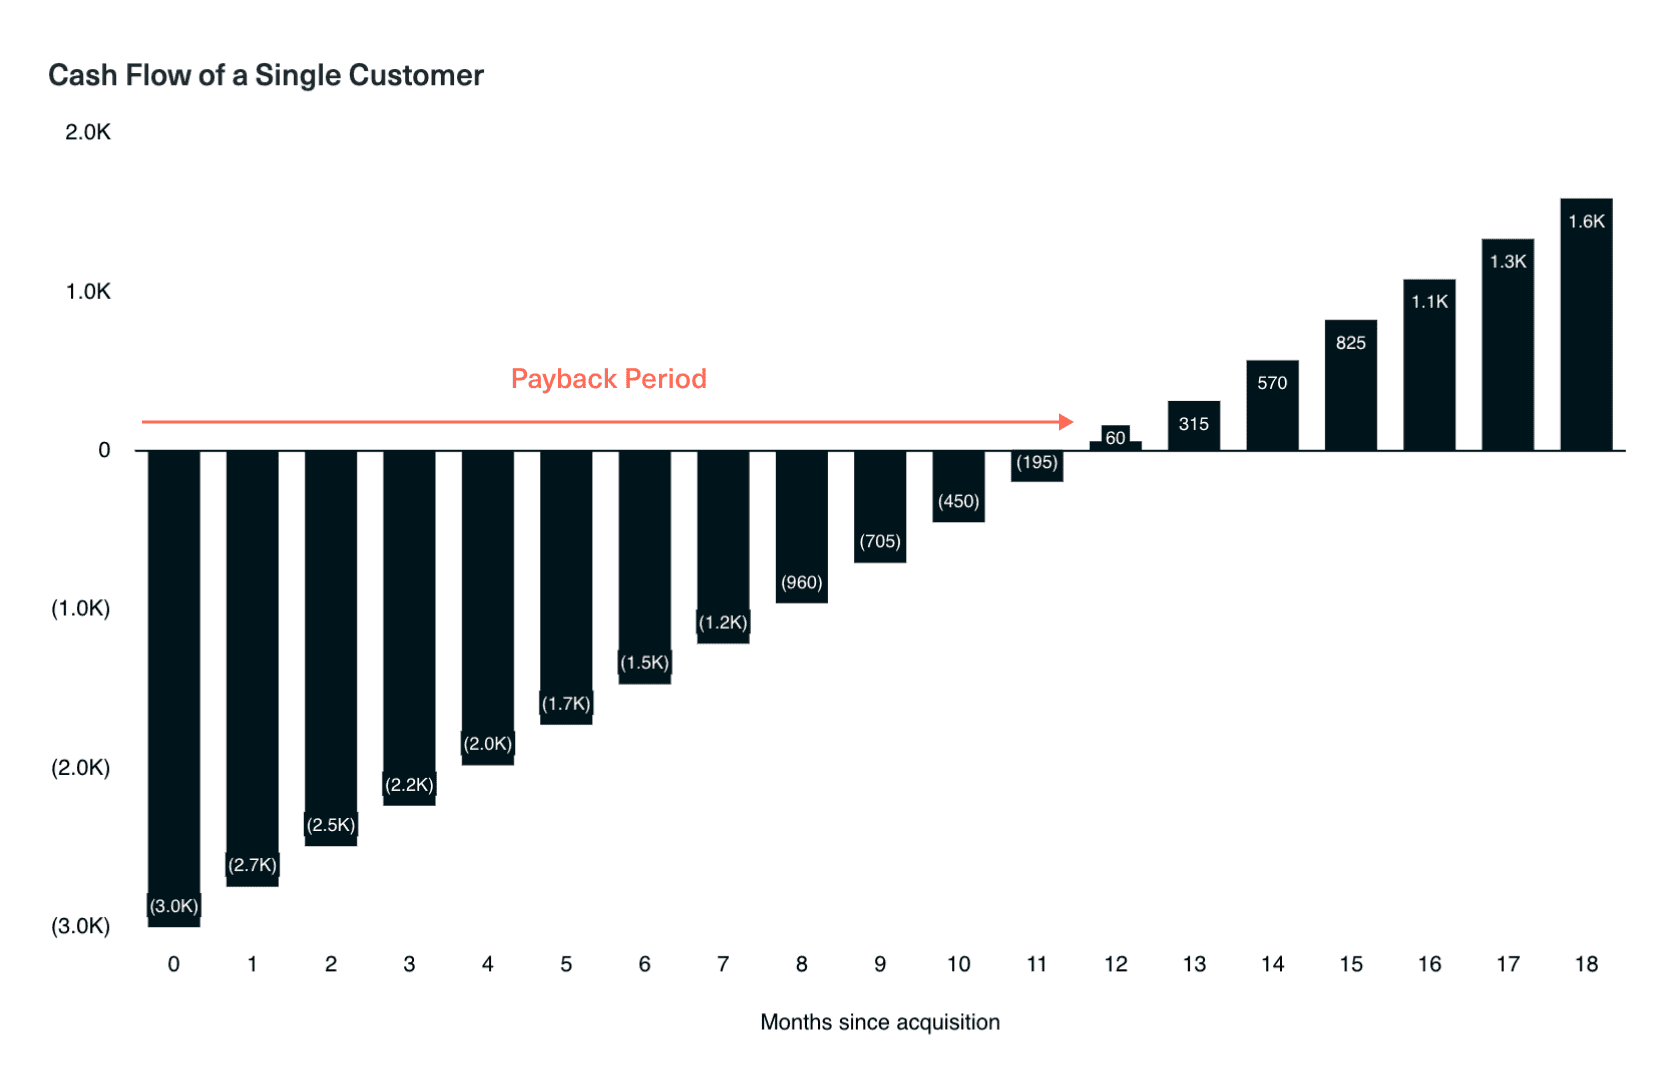
A shorter Payback Period improves cash flow, freeing up capital for reinvestment back into the growth of the business. This is crucial because cash runway is the lifeblood of any startup and because speed is a startup’s primary competitive advantage over larger, slower incumbents.
A longer payback period strains your cash reserves, hampering your ability to invest in growth or weather unexpected challenges. Remember the Global Financial Crisis in 2008? Surely, COVID-19.
A longer Payback Period also introduces an opportunity cost because you’re tying up valuable resources that could be deployed more productively elsewhere.
To illustrate this dynamic, consider the example of two businesses with the same LTV:CAC ratio but very different payback periods.
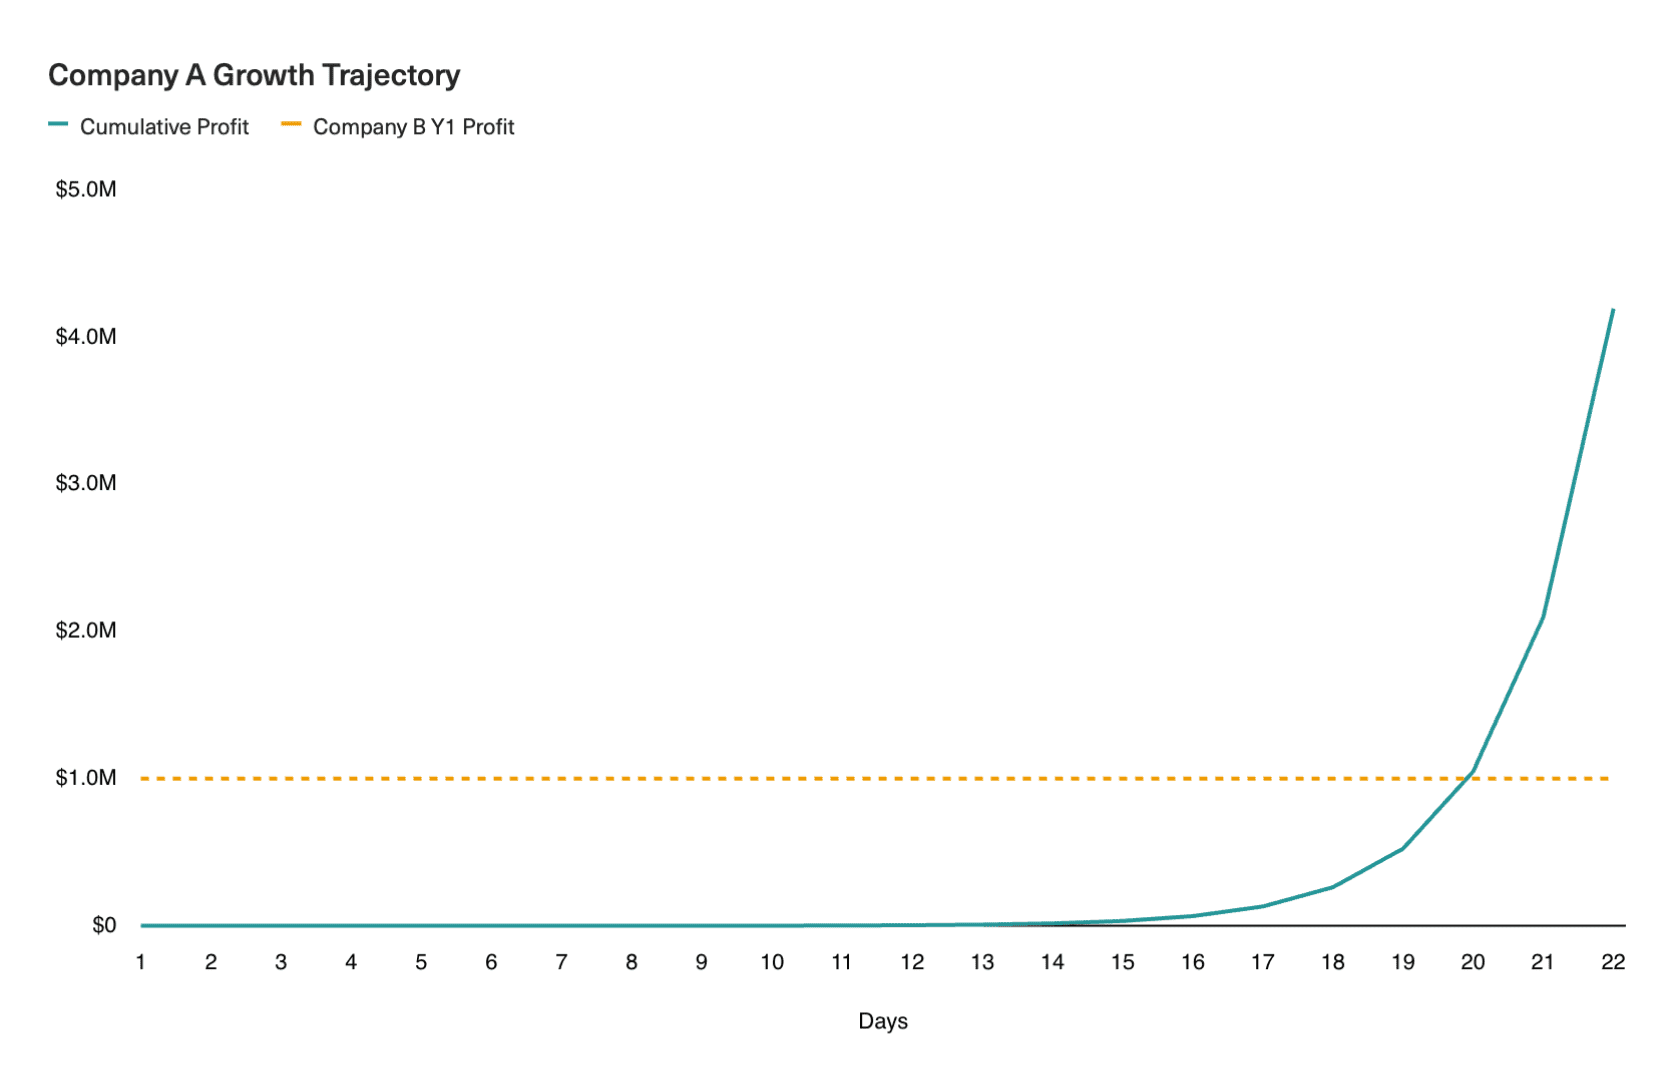
Company A operates on a small scale but with rapid capital turnover: it invests $1 into the business and then recoups $2 of profit within a day. Meanwhile, Company B invests $1 million and then a year later recoups $2 million.
Despite their identical LTV:CAC ratios (2:1), their differing payback periods (a day vs. a year) suggest vastly different growth trajectories for each business. Company B’s slower velocity means that capital is tied up for an entire year before the company can re-invest in future growth. Meanwhile, by continuously reinvesting capital back into the business, Company A can potentially generate $1 million in profit within just 20 days and $2 million in profit within 21 days.
Not only is Company A able to compound its gains by quickly reinvesting its profits, it also has far more optionality in deciding how to reinvest that profit, allowing it to respond more quickly to customer feedback and shifting market conditions.
Meanwhile, Company B must commit to its current trajectory for an entire year before it can change course. In the world of SaaS, a lot can change within a year. AI, anyone? 😅 As a result, while Company B is seemingly a larger and more established business, its slower velocity makes it a riskier investment than Company A.
How to calculate Payback Period
Method 1: Simple
A simple shorthand method for calculating Payback Period is to divide CAC by Average Revenue per Account (ARPA). The result is essentially the breakeven point at which the cost invested in acquiring a customer is equivalent to the cumulative revenue gained from that customer:
However, this back-of-the-envelope method makes a few simplifications. First, it assumes that ARPA stays constant over time when, in reality, ARPA regularly shifts due to factors like market climate and seasonality.
Revenue from any given customer cohort also tends to ramp up slowly as loyal customers grow their spend. Many talk about this as a “land and expand” type motion. Not accounting for this ramp can lead you to believe your Payback Period is better than it is.
Second, ARPA does not account for COGS or the cost of continuing to service customers over time. This excludes significant costs for any startup and means that ARPA overstates the profitability of a customer relationship.
Method 2: Cohort-based
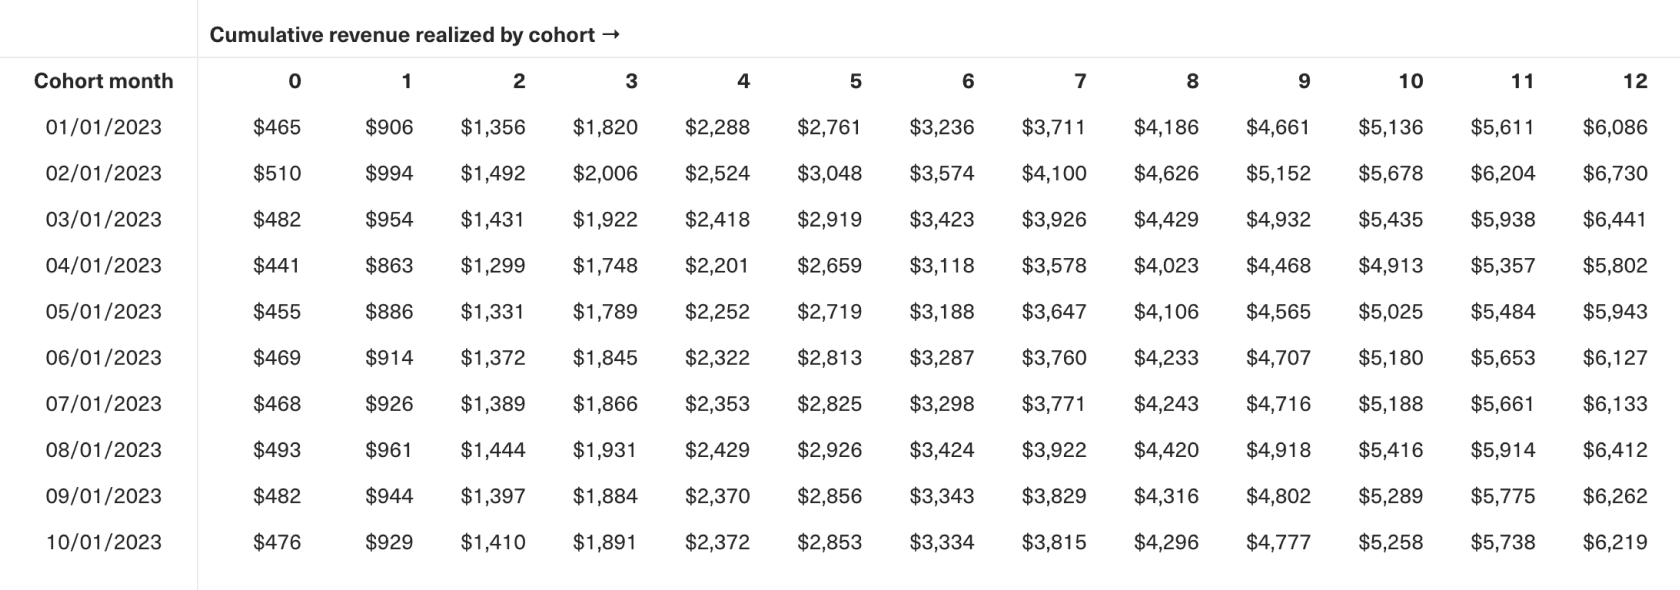
For a more comprehensive estimate of the Payback Period, let’s examine the cohorts we built to calculate LTR.
You’ll need to multiply every cell in your LTR cohort analysis by your Gross Margin to arrive at a table that shows the cumulative LTV realized from a customer in each cohort over time. By basing our Payback Period on this analysis, we’ll account for our COGS (included in our Gross Margin) and the ramp-up in customer spend over time.
First, we’ll start with the cost of acquiring a given cohort, which is simply the total amount of sales and marketing (S&M) spend for the period in which the cohort was acquired.
Next, to calculate the Payback Period for each cohort, compare the costs of acquiring the cohort to the cumulative LTV.
The point at which the cumulative LTV equals those costs is the Payback Period — the amount of time it took to break even on the cost of acquiring a customer in that cohort.
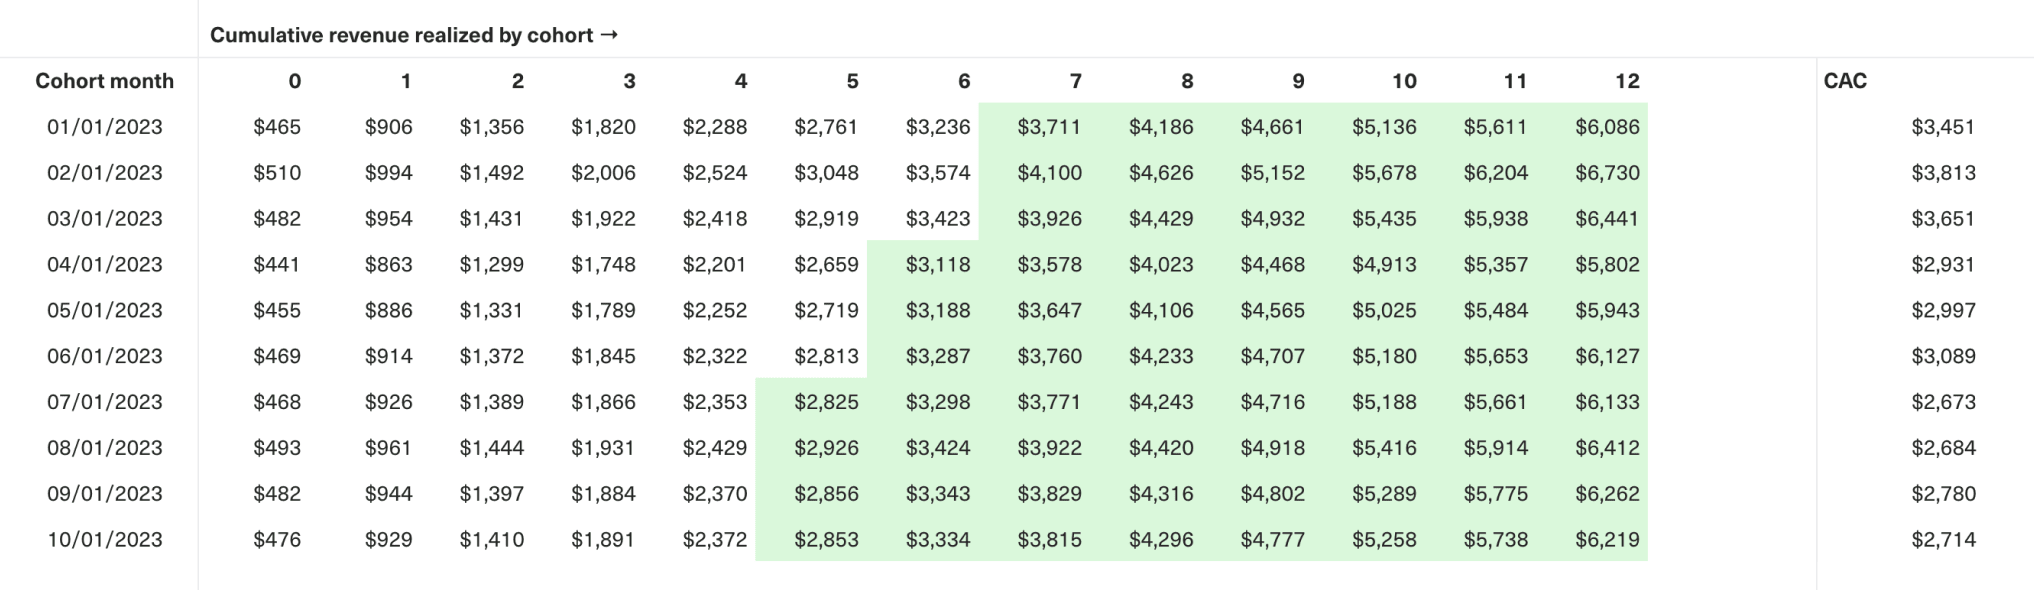
With this approach, you can track how your Payback Period shifts over time as you onboard new customer cohorts. This gives you visibility into the impact of any strategic changes made to the business and external shifts in market conditions.
For example, in this case, we can see that our CAC has improved across each successive cohort as we’ve made adjustments to improve the efficiency of our Go-To-Market (GTM) efforts. This led directly to a lower Payback Period for July-October cohorts compared to January-March cohorts. We can safely invest in scaling up acquisition, knowing it’ll take less time to get that money back. Sweet.
How to optimize Payback Periods
Below are the general benchmarks for a “good” Payback Period for a B2B SaaS business.
| Payback Period | Description |
|---|---|
| < 6 months | Great. Companies with a payback period of less than 6 months are typically highly scalable, and are able to quickly reinvest into compounding growth. |
| 6-12 months | Good. A payback period within this range for a B2B company reflects a healthy balance between acquisition costs and customer revenue. |
| 12-24 months | Acceptable. Suggests room for improvement in either reducing CAC, improving customer retention, or increasing the average revenue per customer. |
| 24+ months | Challenging. Signals a need for a critical reassessment of the business model, pricing strategy, and P/M fit. Such long payback periods can jeopardize business sustainability unless substantial capital reserves are available. |
Remember that these benchmarks vary based on the type of customer you’re servicing. A B2C business with generally shorter buying cycles (and higher churn) should aim for a faster Payback Period of about three months. Enterprise B2B companies, on the other hand, may see Payback Periods stretch out to 18-24 months or longer. If your business services multiple verticals, consider segmenting your payback period so you don’t underfund larger deals.
One of the most proven and powerful methods for optimizing Payback Periods is to charge customers an annual fee upfront. If that annual payment exceeds your CAC, you can recover acquisition costs when the customer converts. Be careful, though — if the annual fee is less than CAC, you could see slower Payback Periods than you would with monthly pricing.
To further improve payback velocity, look at ways to speed up your sales cycle through sales automation and streamlined customer onboarding. The faster you can convert and onboard a customer and get them to pay for the value they derive from your product, the better — for everyone involved.
Optimizing Payback Periods should be seen as a cross-functional effort involving improving LTV and decreasing CAC. In addition to improving CAC through more efficient marketing and sales motions, align your product and customer success teams around improving activation, retention, and monetization.
Next topic