The Guide to
SaaS Metrics
The Guide to
SaaS Metrics
Table of Contents
- Introduction
- Metrics to Measure
- Operationalizing Metrics
- Visualizing Metrics
- Sharing Metrics with Your Board
- Fundraising with Metrics
- Good Luck Out There
- Appendix
Find the levers to grow faster →
GTM analytics that shows you what's working — and what's not.
Metrics to Measure
- By
-
 Bobby Pinero
Bobby Pinero
Bobby Pinero
15+ years of corporate finance experience, currently co-founder at Equals and board member at Intercom.

This guide is intended to be a single-stop reference for all the metrics that matter to your SaaS business. But before diving in, remember that no single metric can provide a complete picture of your business’s health. Each metric must be interpreted in the context of the others. And know that a change in one metric usually has a ripple effect. This interplay between metrics is what will enable a comprehensive understanding of your SaaS business and its potential value.
For example, let’s revisit the Triangle of Despair. Taking a step back, we can see that our initial Customer Acquisition Costs (CAC) form the triangle’s depth. The incremental revenue gained between periods aligns with the Average Revenue Per Account (ARPA), and the cumulative absolute value across every bar represents the cumulative Customer Lifetime Value (LTV).
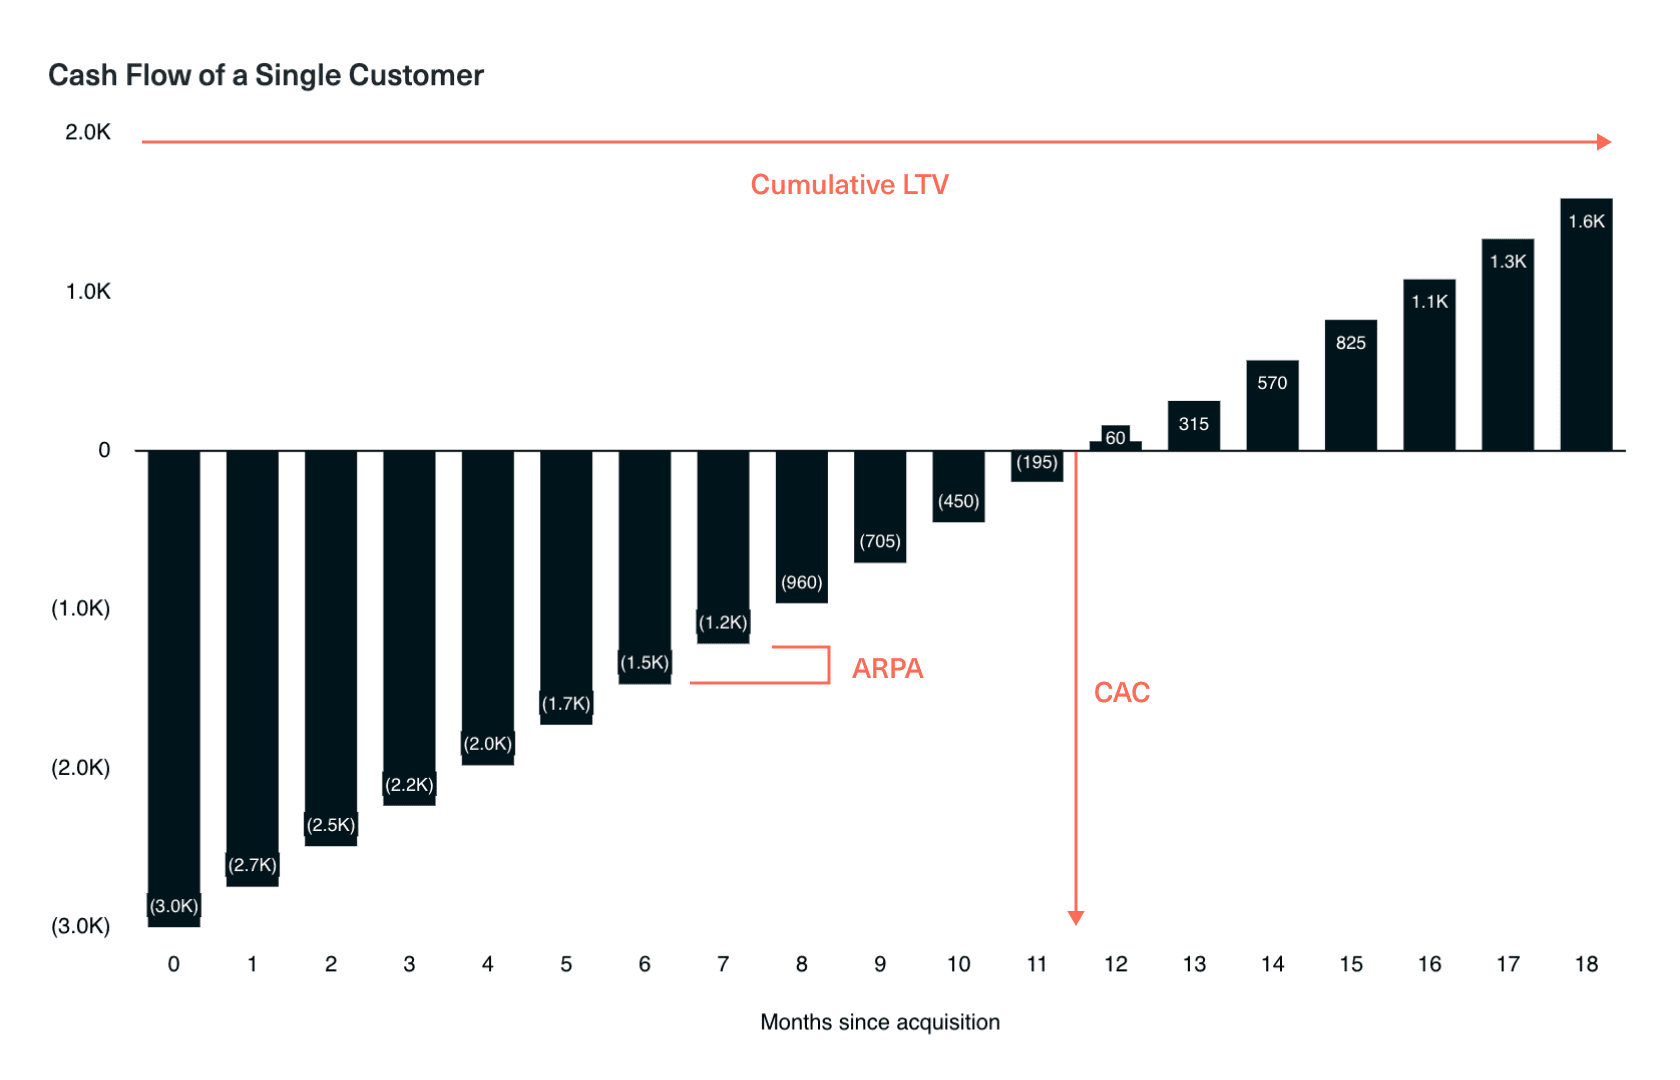
This illustrates that a SaaS business must effectively manage all these dynamics to escape the Triangle of Despair. The critical question is: How quickly can despair turn into profitability? And how big is the prize outside the triangle?
| Category | Description | Metrics |
|---|---|---|
| Unit Economics |
How profitable is each customer relationship over its lifetime? Can we scale customer acquisition sustainably? |
Average Revenue Per Account (ARPA) Lifetime Revenue (LTR) Lifetime Value (LTV) Customer Acquisition Cost (CAC) LTV:CAC Payback Period |
| ARR | How is our recurring revenue growing, and what are the key factors driving changes in this growth? |
ARR ARR Components (Gross New, Churn, Contraction, Expansion, and Restart ARR) |
| Retention | How effectively are we retaining our customer base, and what are the reasons for customer loss or reduction in spend? |
Gross Logo Churn Gross Dollar Churn Net Dollar Churn Gross Dollar Retention Net Dollar Retention Logo Retention |
| Engagement | How frequently and deeply are users interacting with our product, and what does this imply about its value? |
DAU, WAU, MAU DAU/WAU, DAU/MAU A3x7 |
| Investor Benchmarks | How efficiently is our company using its resources to generate growth, and how does it compare to market expectations? |
ARR Multiple Burn Multiple Magic Number |
Let’s find out.
Next topic