The Guide to
SaaS Metrics
The Guide to
SaaS Metrics
Table of Contents
- Introduction
- Metrics to Measure
- Operationalizing Metrics
- Visualizing Metrics
- Sharing Metrics with Your Board
- Fundraising with Metrics
- Good Luck Out There
- Appendix
Find the levers to grow faster →
GTM analytics that shows you what's working — and what's not.
Fundraising with Metrics
- By
-
 Bobby Pinero
Bobby Pinero
Bobby Pinero
15+ years of corporate finance experience, currently co-founder at Equals and board member at Intercom.

Fundraising is not just about showing growth and potential. It’s about telling the story of your business — a compelling narrative that articulates where your company has been, where it’s going, and the “why” behind your vision. Here, we’ll explore how to effectively use metrics in your fundraising process to craft a narrative that resonates with investors and gets them invested (pun intended) in your company’s potential.
Balance transparency with focus
When presenting to potential investors, the key is to share just enough metrics to support your story compellingly — no more, no less. Overloading investors with data can dilute your narrative, while sharing too little may lead them to think there’s something to hide.
Each metric you decide to share should enhance your story, spotlighting successes and acknowledging challenges. If you share a challenge, come prepared with a plan showing how you’re proactively addressing that shortcoming.
If you don’t share a challenge upfront, be prepared to address it when it comes up — because it will, and the last thing you want to do is be caught off-guard. This transparency shows that you’re proactive, fully aware of your business dynamics, and prepared to do what it takes to get on the right track.
Craft a data-driven narrative
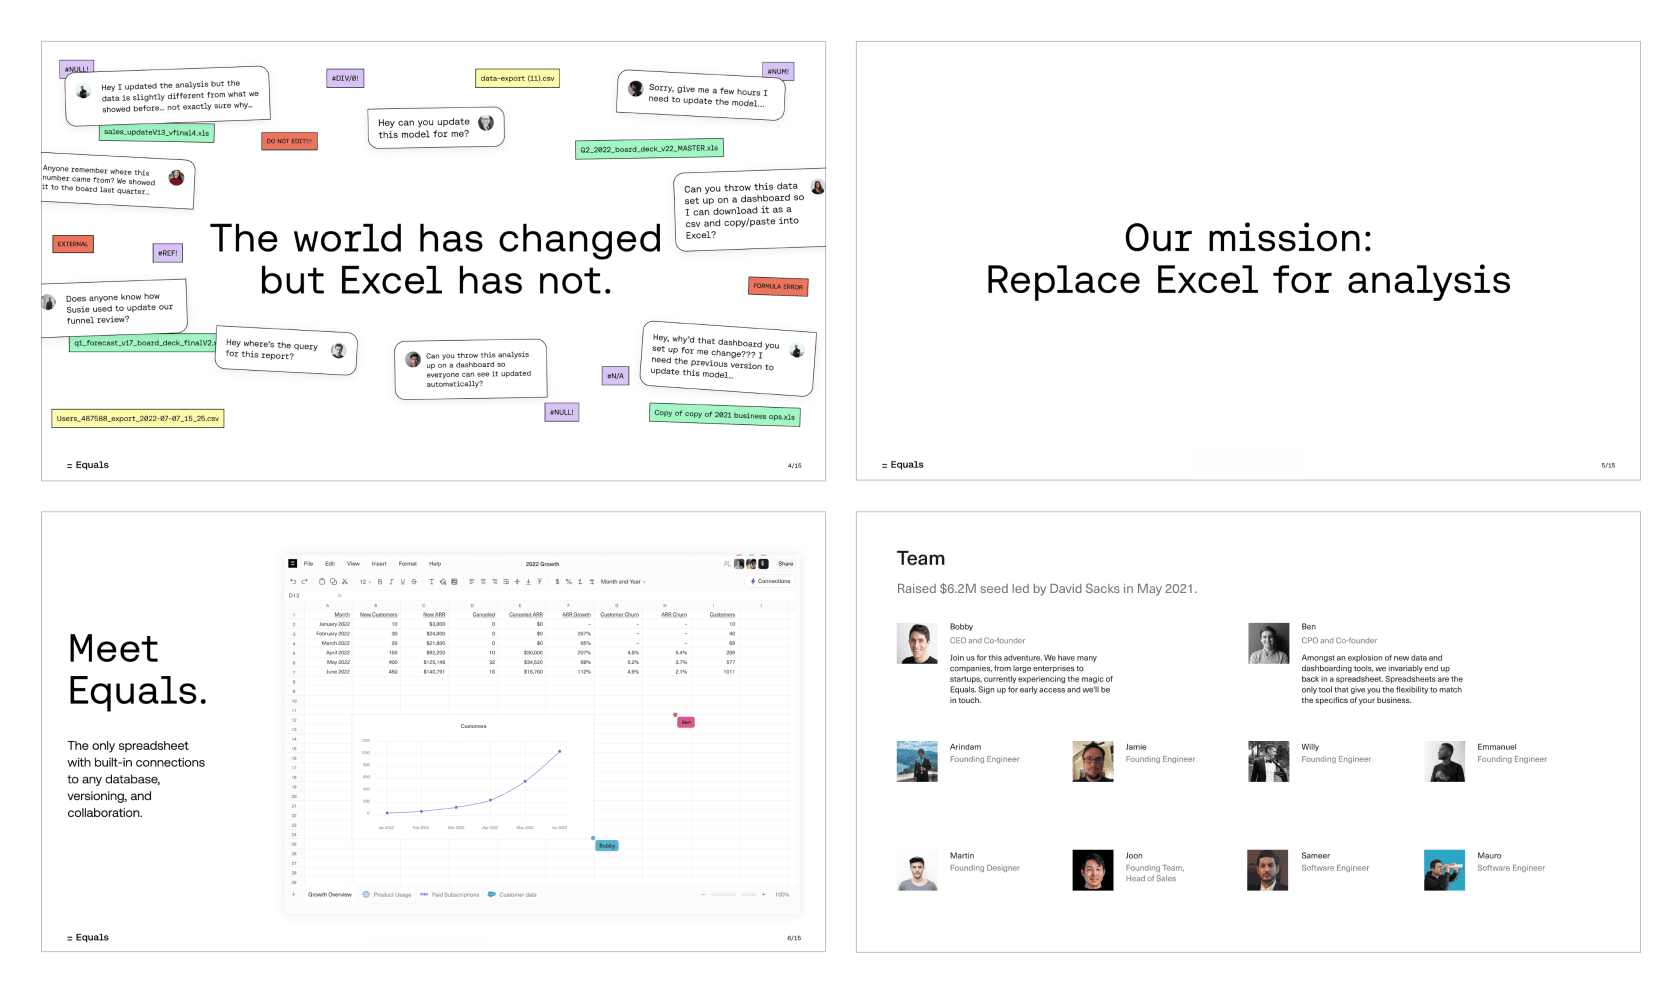
We’d advise that your fundraising pitch include two components: a Pitch Deck and a Data Deck.
Your Pitch Deck tells the broader story of your business. It’s a concise, punchy narrative that walks through your business’s origins, mission, and strategic growth plans. To ground this story, focus on the three P’s:
- Problem: What is the core problem you’re solving, and why is that problem worth solving?
- Product: What have you built so far? Do you have signals of traction? How will you prioritize the roadmap to build towards your ultimate vision?
- People: Why are you the best-equipped team to take on this problem?
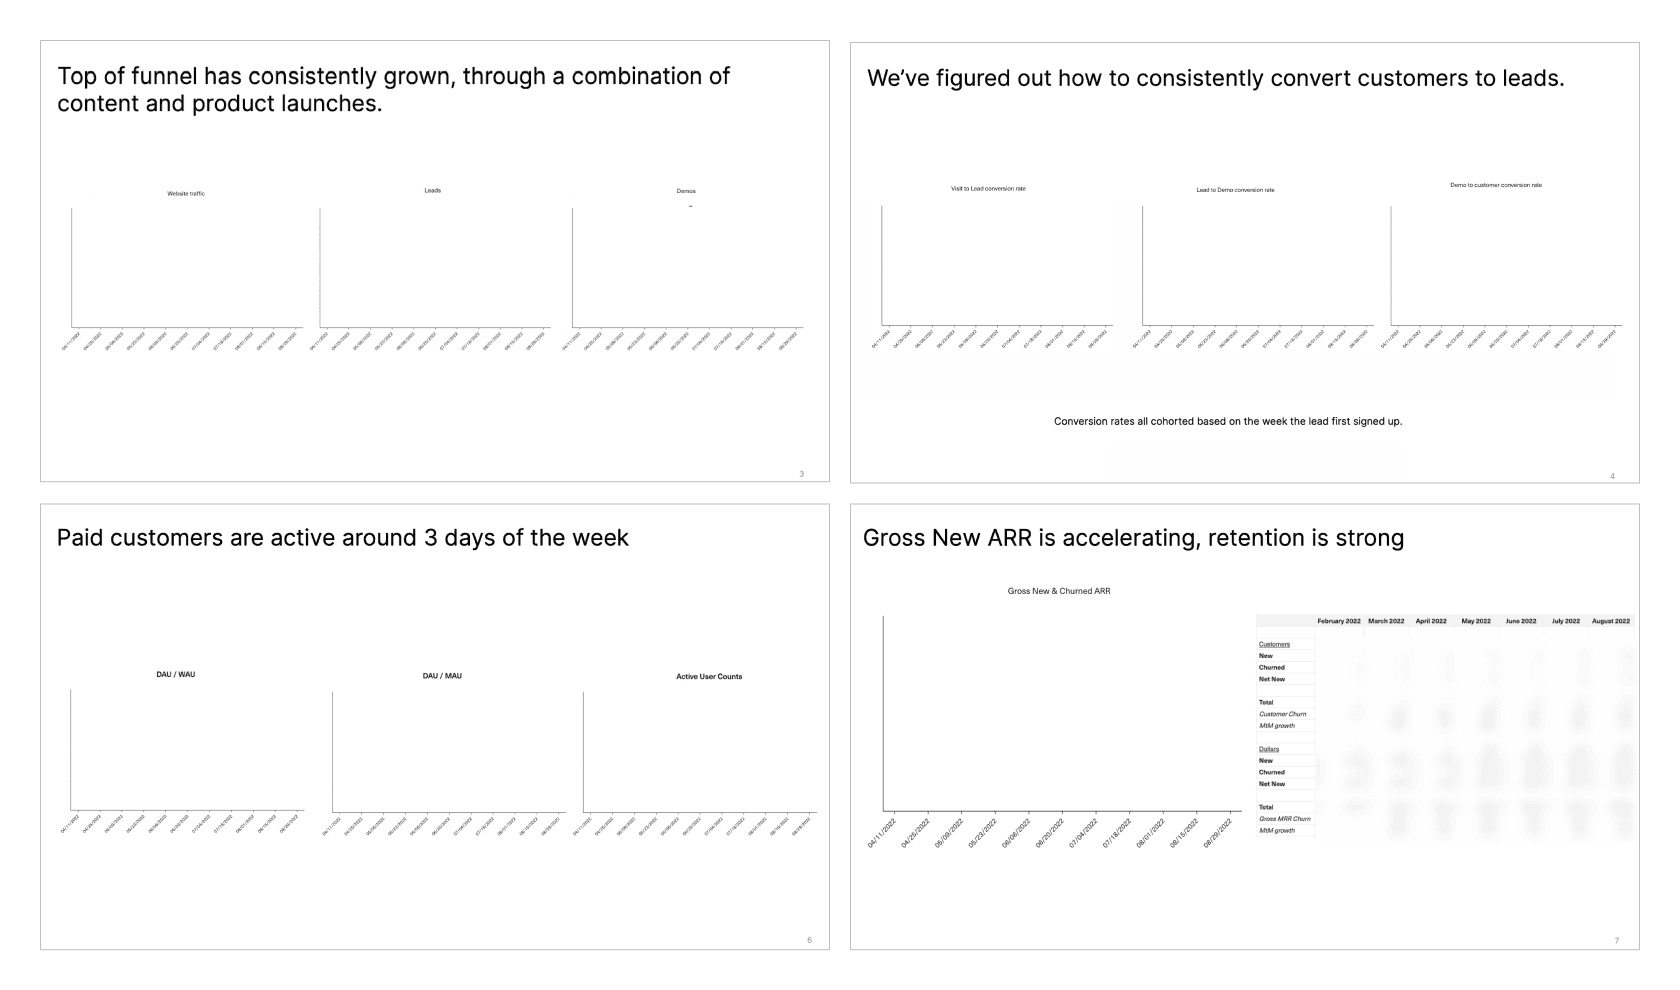
The Data Deck allows you to delve deeper into your company’s fundamentals with comprehensive “hero” metrics.
Why come prepared with a Data Deck? Investors will always ask for more data. Because they turn down 99% of deals, they’re also looking for a reason to say no rather than yes. Hand over a raw data file, and investors (or their armies of analysts) will find a reason to say no. Instead of leaving the door open, use your Data Deck as an opportunity to take command of the narrative by pre-empting every question an investor could possibly ask of the business.
Your Data Deck metrics should follow a cohesive narrative, walking through what drives your ARR, how efficiently you acquire customers, and how effectively you retain and monetise them. Here are a few of the highlights:
- Revenue: While you won’t need to show massive revenue numbers at earlier stages of the fundraising process, you will need to show your top-line ARR growth and break out your ARR into its component parts.
- Acquisition: Demonstrate the efficiency of your acquisition. Depending on your fundraising stage, the most important metrics are customer logo growth rates and funnel conversion (if you’re early-stage) or your LTV:CAC and Payback Period (if you’re later-stage).
- Retention: Investors take this very seriously: They do not want to pour water into a leaky bucket. Would you? To give investors a comprehensive understanding of your retention, we recommend breaking out retention metrics across three views: Net Dollar Retention, Logo Retention, and Gross Dollar Retention. We’d also show these metrics on an annual and cohorted basis to showcase how they’ve trended over time.
- Engagement: Savvy investors know that engagement metrics are among the best indicators of a company’s potential for growth. Use metrics like DAU, WAU, and MAU, as well as their ratios (like DAU:WAU and DAU:MAU), to illustrate the frequency and consistency with which customers interact with your product.
Finally, you’ll need to roll everything up into an operating model: an overview of the key levers that drive your business outcomes and impact cash flow, the lifeblood of your business.
Build a crisp income statement model that’s connected to your ARR model. This will show where you’re going to invest capital — be it marketing discretionary spend, R&D headcount, or something else.
You want to show that your Gross Margin can scale nicely — meaning you will make more money for every dollar of revenue you bring in over time. You’ll also want to highlight how you’re managing your runway, showing how you’re giving yourself ample time to raise future capital or get to positive cash flow as a business. This approach shows that you’re not only managing your current finances but also preparing to scale in a sustainable way.
Across all of your metrics, segment your financials by the dimensions that have the biggest impact on your business outcomes, whether that be customer size, industry or geography. Explain why these segments differ and how you intend to shape them over time to drive top-level impact for the business.
Contextualize your metrics
While every business is different, an investor’s job is to look across all of them and pick out the ones most poised to break out from the pack. They typically do that by studying those that have previously broken out and applying those patterns to emerging companies.
That’s why it’s useful to frame metrics in the context of how other break-out companies have performed at your stage. This helps bridge the mental gap for an investor struggling to see how your business comes together.
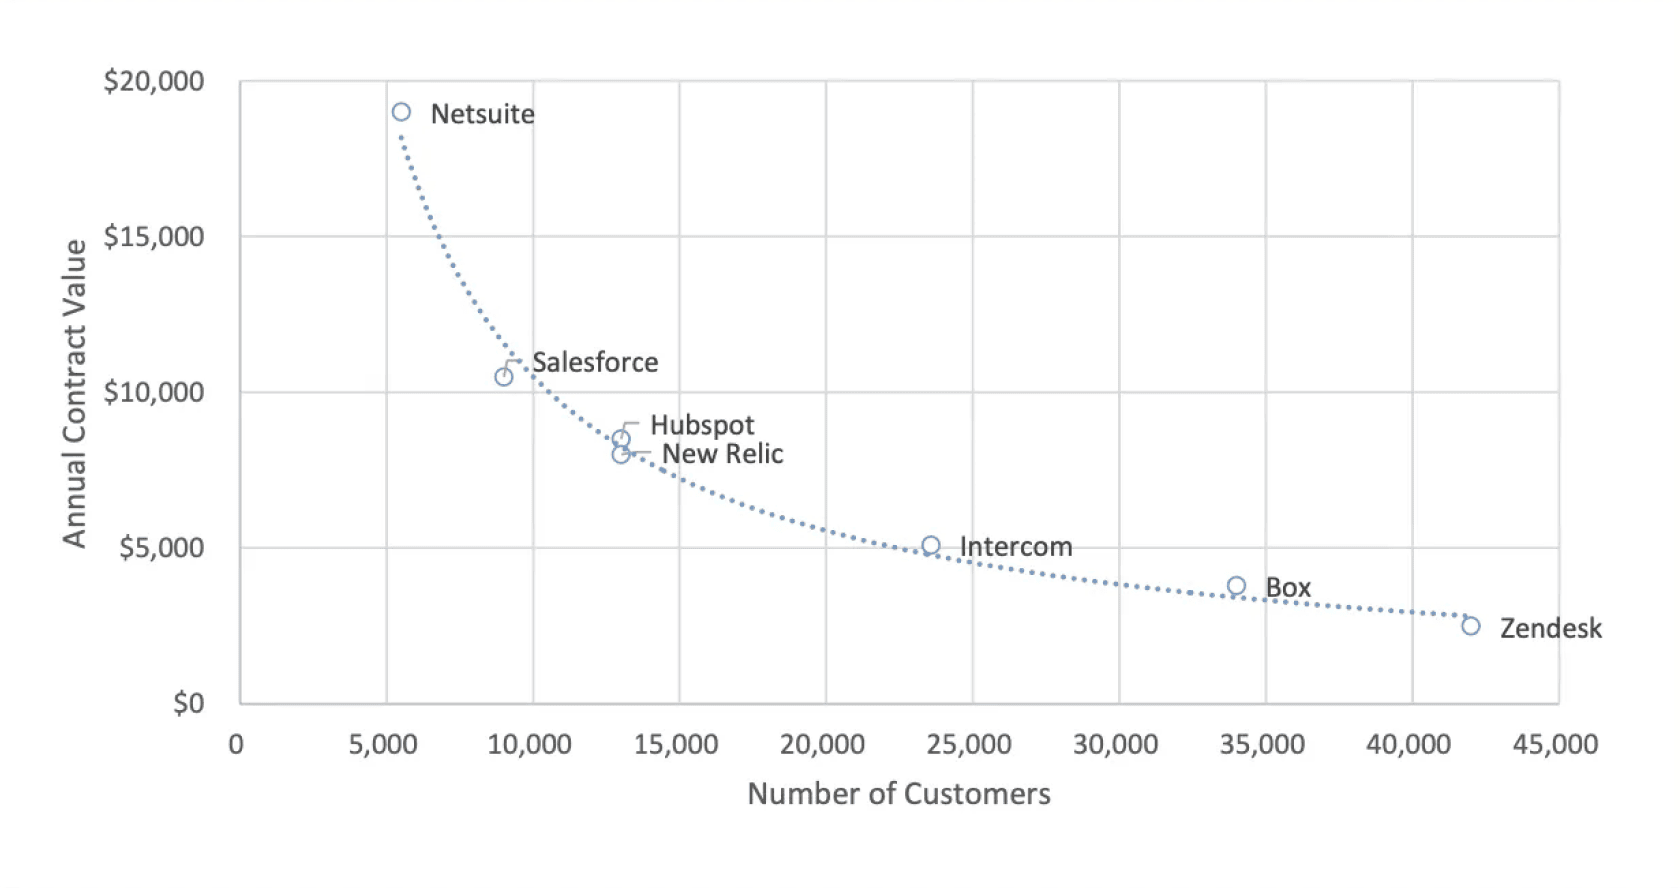
For example, in the early Intercom days, we’d have a slide in our investor data deck that showed what we believed our customer count and ACVs looked like relative to our peers. This helped give credibility to our $100M ARR forecast and opened a conversation about how we were similar to and different from those peers. The more you can do this across all your metrics, the better.
Investors also tend to have different expectations for the performance of the business (and benchmarks for return on investment) at different fundraising stages. The way you treat metrics should evolve as the business matures:
- Seed stage: You often focus on the team and the vision rather than hard metrics. Investors are betting on you, your team, and your potential to execute the vision. Lean on qualitative feedback to help validate that the market needs your product.
- Late Seed to Series A: You’ll generally have a real business and some early signals of market traction. Investors are looking for a 10x return. Here, metrics begin to play a role, but they don’t need to demonstrate full economic viability just yet. Instead, investors look for signs of potential leverage and scalability through indicators like user engagement and ARR growth rates.
- Series B+: Investors expect to see a proven, sustainable business model ready for scale. They are looking for a 2-5x return. You’ll need to demonstrate a repeatable go-to-market motion and solid unit economics through metrics like LTV:CAC, Payback Period, Net Dollar Retention, and Gross Margin. Your ability to achieve previously set forecasts will also increasingly become a track record that lends credibility to your future projections.
Next topic