The Guide to
SaaS Metrics
The Guide to
SaaS Metrics
Table of Contents
- Introduction
- Metrics to Measure
- Operationalizing Metrics
- Visualizing Metrics
- Sharing Metrics with Your Board
- Fundraising with Metrics
- Good Luck Out There
- Appendix
Find the levers to grow faster →
GTM analytics that shows you what's working — and what's not.
LTR: Customer Lifetime Revenue
- By
-
 Bobby Pinero
Bobby Pinero
Bobby Pinero
15+ years of corporate finance experience, currently co-founder at Equals and board member at Intercom.

What is LTR?
LTR is the cumulative revenue you can expect from a single customer across the duration of their relationship with your business (i.e., the customer’s lifetime). Put simply, it’s the monetary value of a single customer. It’s also the basis for calculating Lifetime Value (LTV), which provides a more comprehensive picture of the value of a single customer, net of the costs to service them.
Unlike a traditional business model where a customer’s value is immediately quantifiable through the initial sale, a SaaS business realizes this value over time. As a result, product “stickiness” — your ability to retain customers over time — is a critical driver of business performance. A stickier product means a longer customer lifetime and, as a result, greater LTR.
Consider the example of a Netflix subscription. Many of us pay around $12 monthly (at the moment 🤪). A drop in the bucket, right?
Let’s say we’re happy with Netflix’s product — so happy we keep our subscription for 50 years. That amounts to a whopping $7,200 ($12 × 12 × 50) throughout our lifetime as customers — a far cry from the $12 we spend monthly. With over 270 million subscribers, Netflix has over $1.9 trillion in revenue potential. Not too shabby.
When looked at this way, LTR is not just about accumulating fees from subscriptions. It’s about ensuring the cumulative value delivered to customers aligns with or exceeds the fees they pay to your business, encouraging them to keep paying for those 50 years and perhaps increase their spending over time. 6k video, anyone?
Remember, though, that LTR should never be optimized in isolation. Instead, the value of a customer relationship must be analyzed in relation to its cost. This comes in two buckets:
- The upfront cost to acquire the customer → CAC
- The cost of continuing to service that customer over time → a component of LTV
As a business, you want the cost of acquiring and servicing a customer to be less than LTR without compromising on quality to the point where you negatively impact LTR (i.e., drive churn). If you’ve both maximized the value customers get relative to LTR and maximized LTR relative to your costs, congratulations — you’ve maximized the value of your business.
In addition to tracking aggregate LTR, you can also segment LTR to ensure that you aren’t masking underlying dynamics in your customer base. This is important since different customer segments can have wildly different LTRs due to varying retention dynamics, willingness to pay, and responsiveness to upsell and cross-sell efforts.
To identify segments, find breakpoints in retention and Average Revenue Per Account (ARPA) and then break out your LTR accordingly. At Intercom, we segmented LTR in multiple ways: self-serve vs. sales, business size, and acquisition channel. This was useful in helping us differentiate customers and hone in on the high-value customer segments that contributed most to the company’s revenue.
How to calculate LTR
There are a few ways to approach calculating LTR depending on your needs.
Method 1: Simple estimate
A straightforward way to estimate LTR is to use this formula:
To understand how this equates to LTR, let’s decompose this formula into the following:
Here, is roughly the expected lifetime of a given customer. For example, a 5% monthly churn rate suggests that a given customer will stay with us for about or 20 months on average.
Taking this rough estimate of a customer’s lifetime, we can multiply by the average revenue a customer generates each period (ARPA) to arrive at the expected revenue the business will gain from a customer throughout their relationship (or LTR). Be sure that the ARPA and churn rate you use are based on the same time period, whether that’s monthly or annually.
Why estimate LTR with this method? It’s a quick, back-of-the-envelope estimate that you can calculate on the fly based on easily accessible metrics. As a result, you’ll often see investors using this method to compare LTRs across companies.
However, this estimate should only be used as a sanity check, not as an operating metric for running your business. It makes the simplifying assumption that ARPA and churn rates stay stable over time when, in reality, they often vary.
For example, churn rates for new customer cohorts are typically high to start but decrease over time as you’re left with a long tail of loyal customers. This dynamic can shift your aggregate churn metric as you add new cohorts of varying sizes to your customer base.
ARPA can also change over time due to various factors, like pricing changes, a shift towards customer segments on lower (or higher) priced plan tiers, or upsell and cross-sell campaigns that increase ARPA.
Method 2: Cohort analysis
We recommend using a cohort analysis for a more precise estimate of LTR. This involves tracking groups of customers acquired during the same period (cohorts) and observing their behavior over time, including how long they remain customers and how much revenue they generate each period. Because cohorts are essentially a longitudinal sample of your business, this method accounts for the impact of ARPA and churn rates as they vary over time.
Step 1: Prepare your monthly revenue data
First, use your subscription or invoice data to “stamp” each customer cohort. A common way of doing this is to group all customers whose first payment happened in the same month.
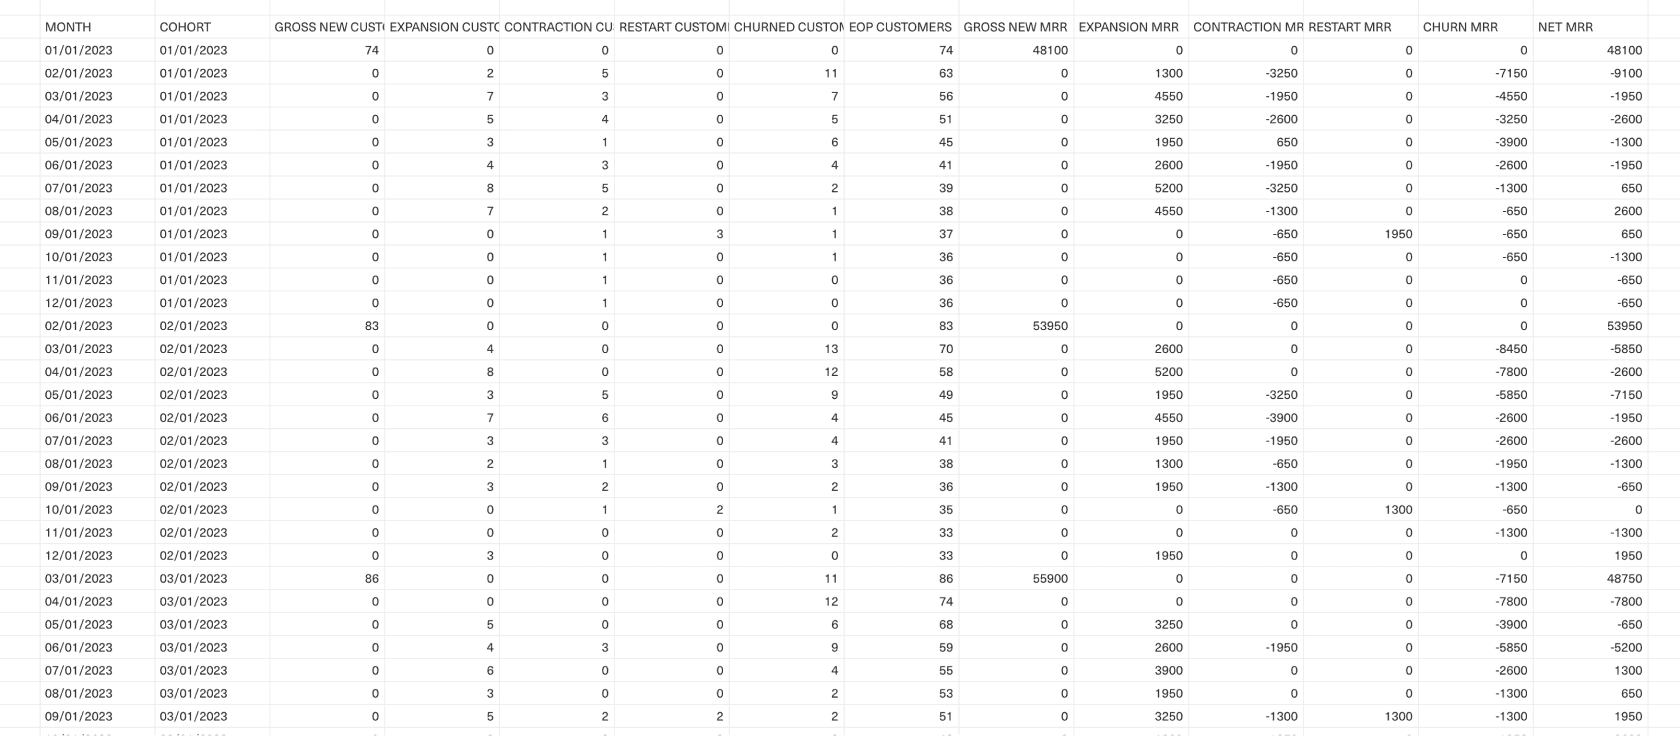
From here, you’ll assemble your cohort table. Simply run out each subsequent month after the cohort is acquired, with each subsequent month showing the remaining MRR balance for that cohort of customers. This MRR balance includes the revenue impact of all upsells (expansion), downsells (contraction), and churns.
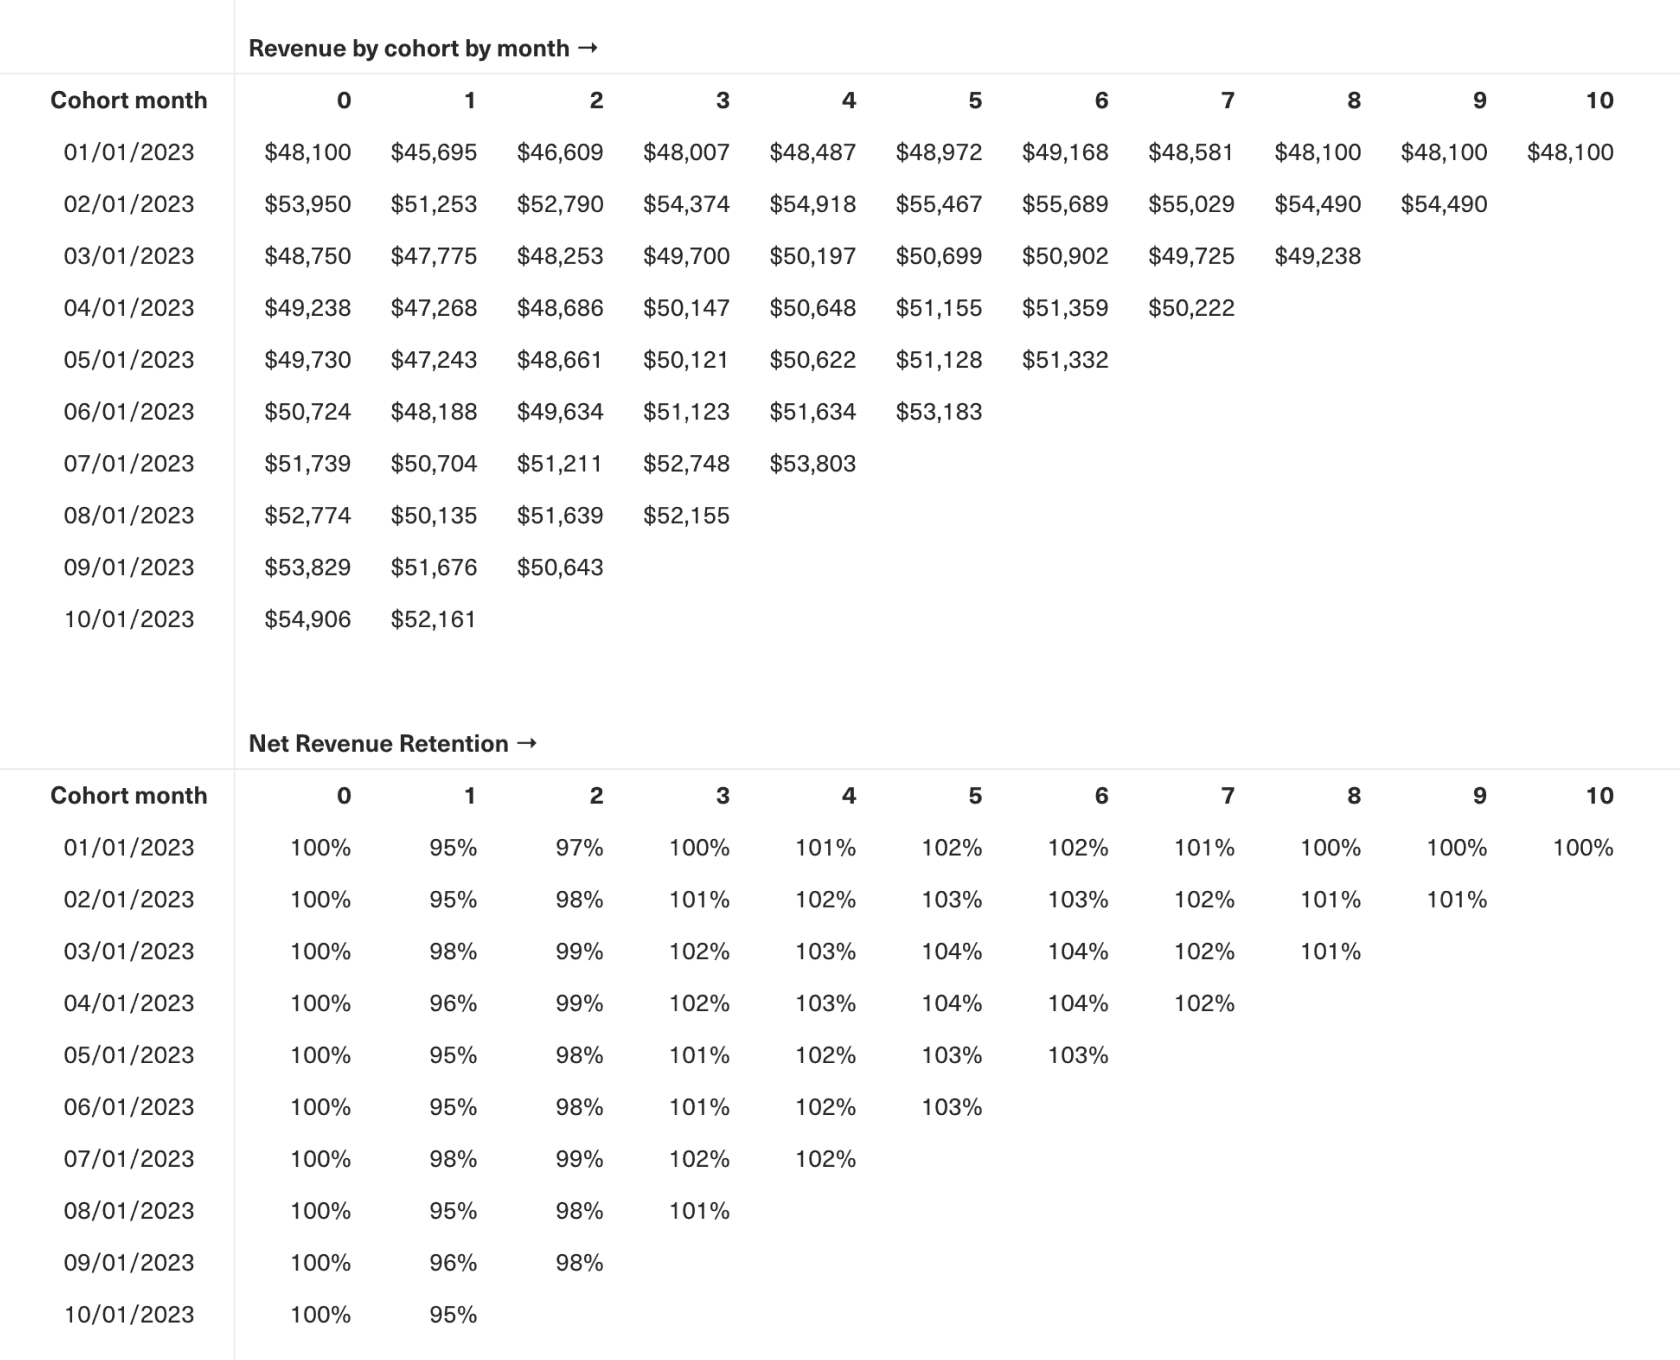
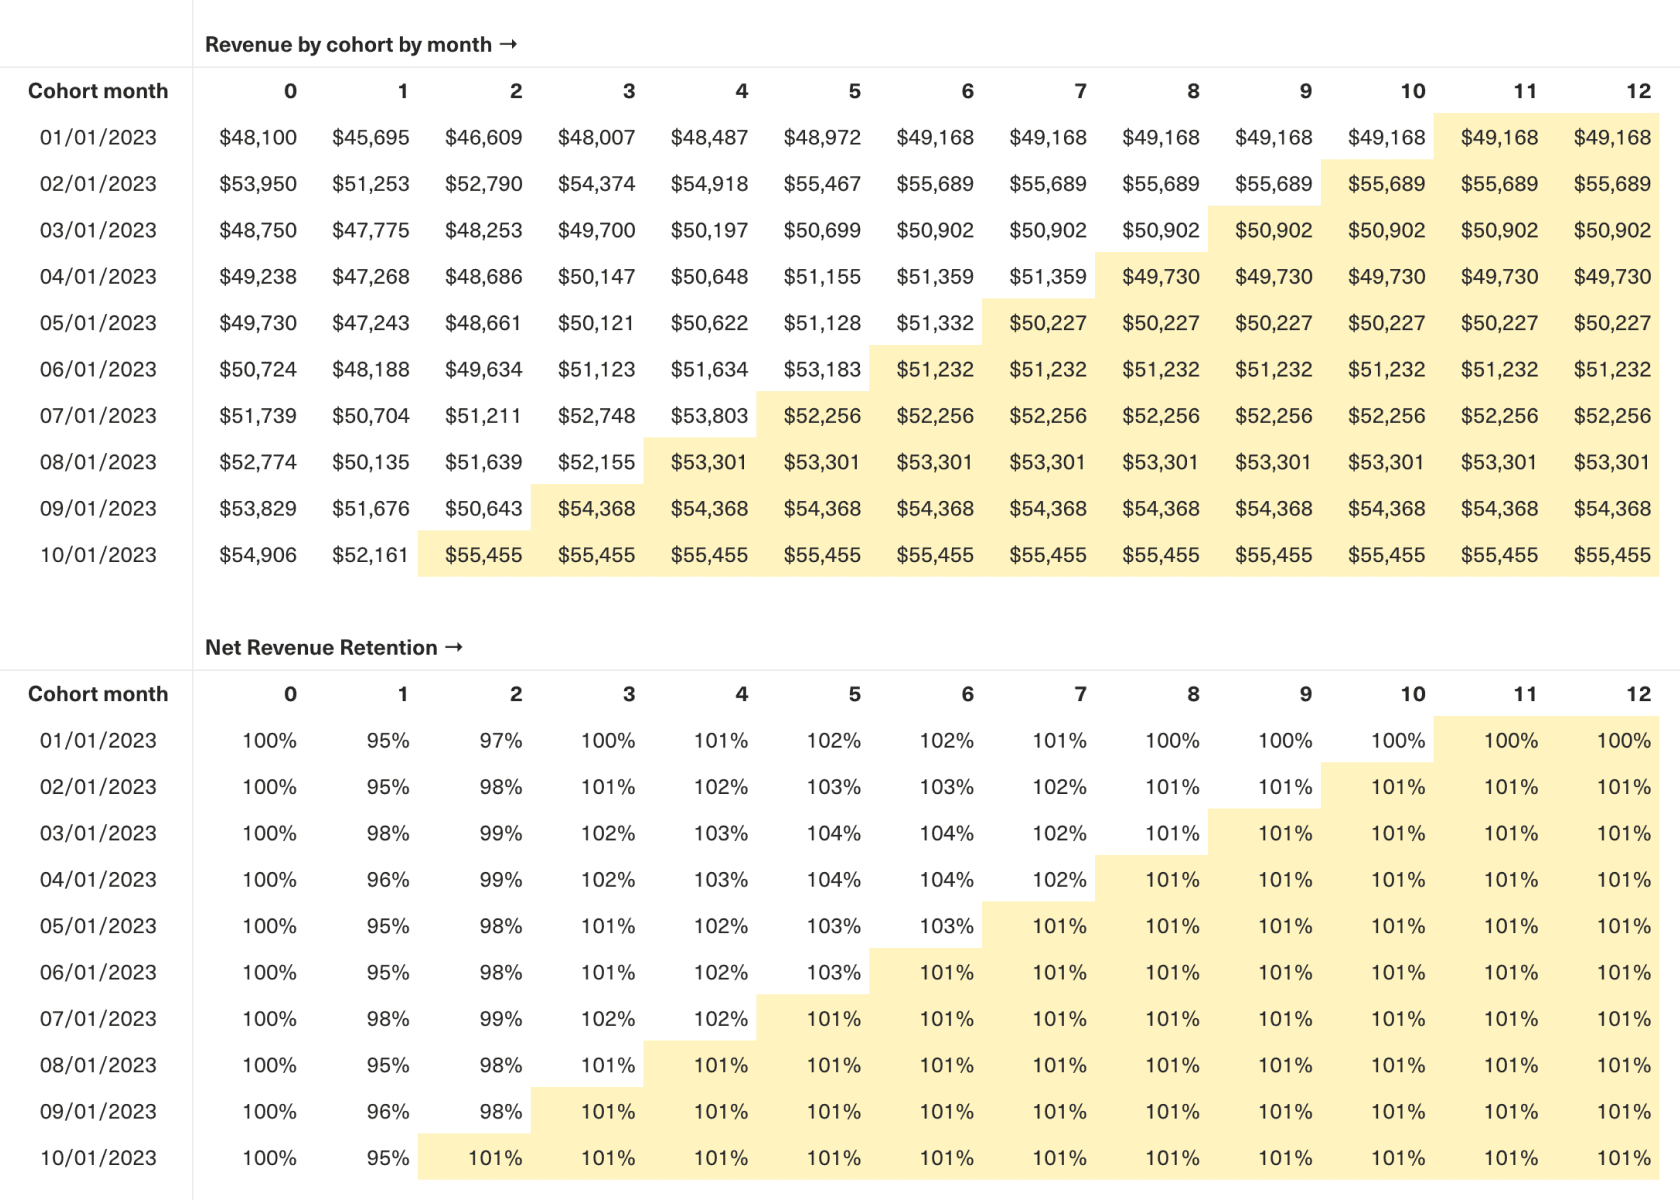
Step 2: Build your retention cohort charts
With your cohort tables prepared, you can start to model future periods. This is the most important and sensitive part of the exercise, so you need to be very careful about the assumptions you make.
The first and probably most crucial assumption you’ll need to make is to determine how far into the future to project LTR — 3 years? 5 years? 10 years? Our general rule of thumb here is that an early-stage company (roughly <$5M in annual revenue) need not go beyond 3 years of LTR. Even that’s generous — projecting out that a given customer will be with you beyond 3 years is a dangerous game. The world changes fast. Similarly, for an at-scale business, the rule of thumb is 5 years. But be careful. We can’t stress enough that things will inevitably change. Sometimes fast!
Next, you’ll need to decide how to model cohorts for which you have little to no data. Fortunately, in most cases, retention tends to steady out at a certain point (often for monthly subscription businesses, we see this around the 6 month mark).
Said a different way, retention in the first handful of time periods tends to be slightly more volatile. Customers churn more quickly. Prices change more quickly, too. Some users don’t realize the value, and others quickly get stuck. Look for the point where your cohorts even out — that’s a good place from which to start projecting forward.
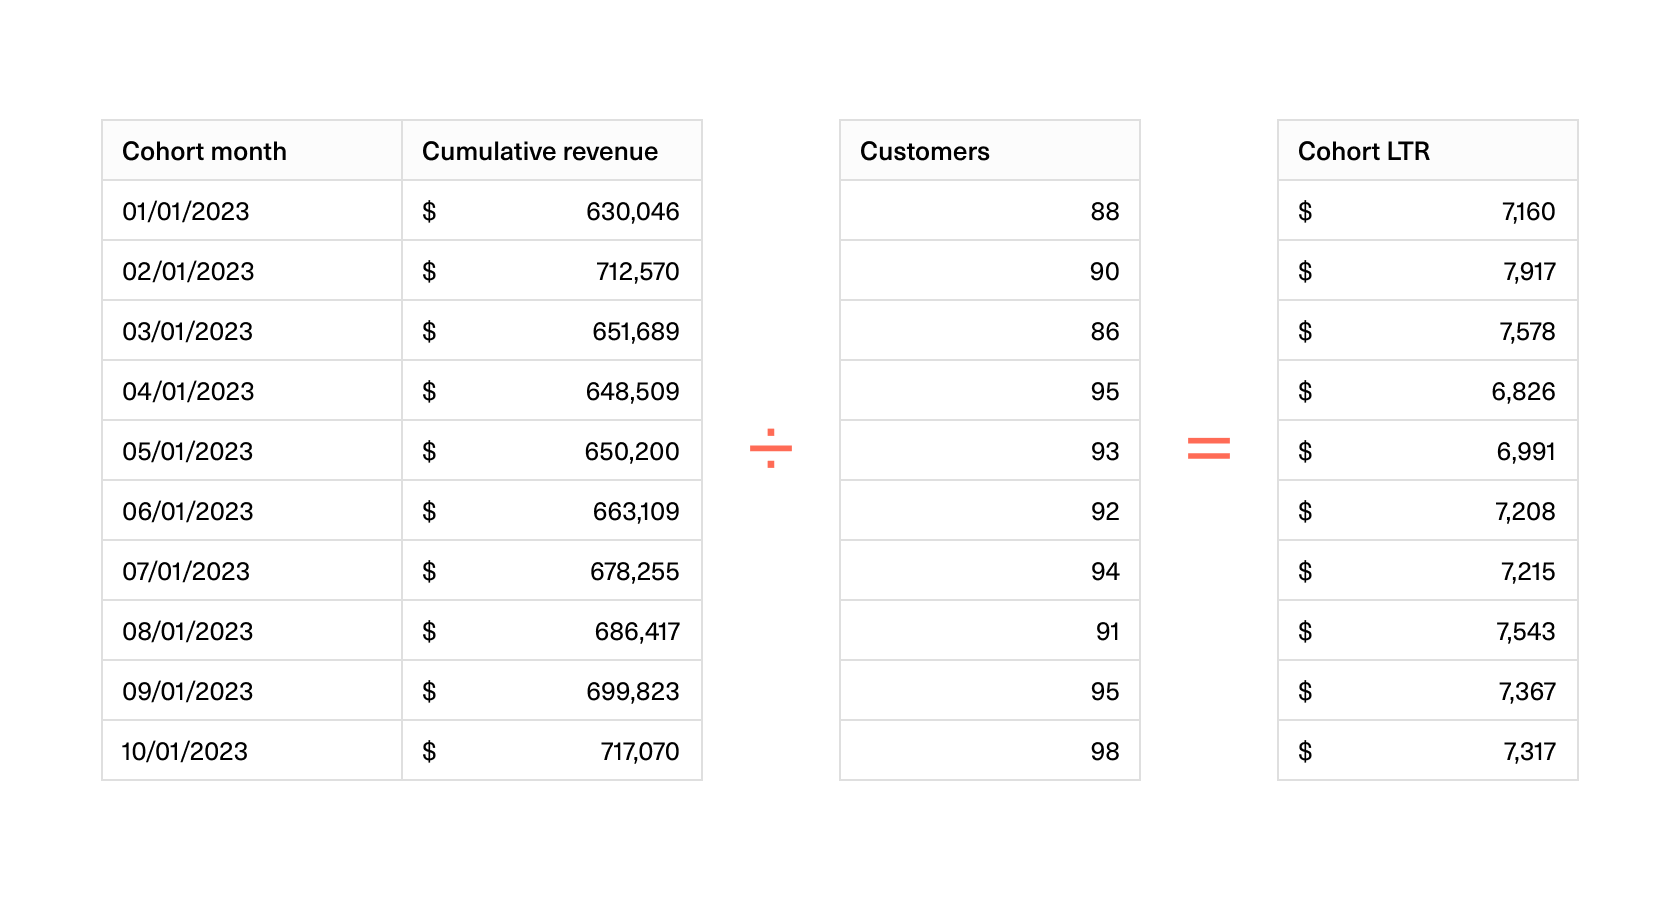
Step 3: Create cumulative revenue and LTR tables
Next, calculate the cumulative revenue generated from each cohort over their lifetime for the entirety of the period you’ve chosen to run the lifetime analysis (3 years, 5 years, or otherwise). To do this, add across each row of net revenue.
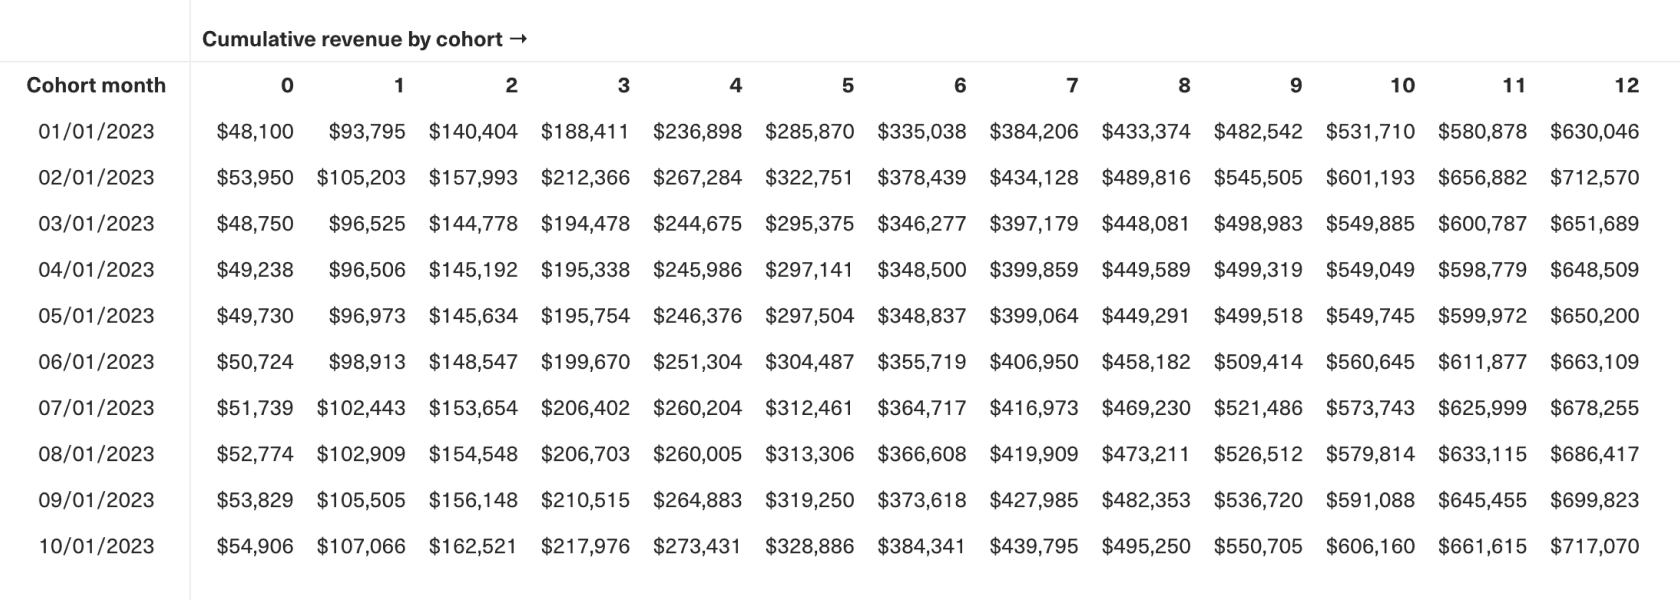
Now, we’re ready to derive LTR. To do that, simply divide the cumulative revenue for each cohort over the course of the customer lifetime (in this example, that’s 12 months) by the initial number of customers acquired in that cohort. This is the lifetime revenue generated by the average customer in a given cohort.
Step 4: Aggregate LTR
To get a big-picture view of customer value across your entire business rather than for a specific cohort, you can calculate aggregate LTR. To do this, sum the total cumulative revenue from all cohorts and divide by the total initial number of customers from these cohorts — this is essentially the weighted average of all your cohort LTRs:
This method effectively normalizes the cohort LTRs, weighting them by the size of each cohort. This represents a typical customer’s lifetime value.
How to optimize LTR
Before we dive in, one caveat: Don’t optimize LTR in isolation. Consider costs when looking at LTR so you don’t overinvest in high-LTR but higher-cost customer segments. Instead, optimize against the profitability of your customer relationships (see LTV:CAC and Payback Period).
To maximize the LTR component of that equation, you have two levers at your disposal:
- Customer retention
- Monetization
Improving retention
This is about maximizing the value you deliver to customers. Engagement metrics are a critical indicator of a customer’s likelihood to retain. There are three questions to ask here:
-
Do you have an onboarding problem, product gaps, or both?
If customers are churning early in their lifecycle, this might be an issue with your onboarding process. Alternatively, if high-value customers who have reached a specific spend or usage threshold are churning, that may be a product issue. Consider shoring up product gaps and adding advanced features to meet their needs. -
How good is the support you provide to customers?
Ensuring that issues are resolved promptly and offering white-glove support to high-value customers helps you to address early pain points that may drive churn down the line. -
Are you acquiring the right customers?
Finally, if churn is up across the board, you may need to reconsider what customers you’re acquiring. Focusing marketing efforts on your Ideal Customer Profile (ICP) — the customers who are most likely to derive value from the product — will improve the overall quality and retention of your customer base over time.
Maximizing monetization
Pricing is a major lever here. Experiment with pricing to arrive at a model that allows you to capture more customer value without discouraging sign-ups or increasing churn.
Implementing targeted upsell and cross-sell strategies to promote additional products and services to your existing customers will allow you to grow expansion revenue without investing more in acquisition.
You can also introduce loyalty programs and tiered service models that encourage higher spending from your existing customers. This allows you to leverage the customers who value your product highly and are willing to spend more to get even more value.
Next topic