The Guide to
SaaS Metrics
The Guide to
SaaS Metrics
Table of Contents
- Introduction
- Metrics to Measure
- Operationalizing Metrics
- Visualizing Metrics
- Sharing Metrics with Your Board
- Fundraising with Metrics
- Good Luck Out There
- Appendix
Find the levers to grow faster →
GTM analytics that shows you what's working — and what's not.
Cohorted Retention
- By
-
 Bobby Pinero
Bobby Pinero
Bobby Pinero
15+ years of corporate finance experience, currently co-founder at Equals and board member at Intercom.

What is Cohorted Retention?
A cohorted retention analysis tracks the behavior of customers acquired in a given period, revealing whether those customers are sticky and increasing their spend. These are crucial levers for growing top-line revenue. With “good” retention and expansion, you can maximize the revenue returned from your upfront investment in customer acquisition and compound that revenue over time.
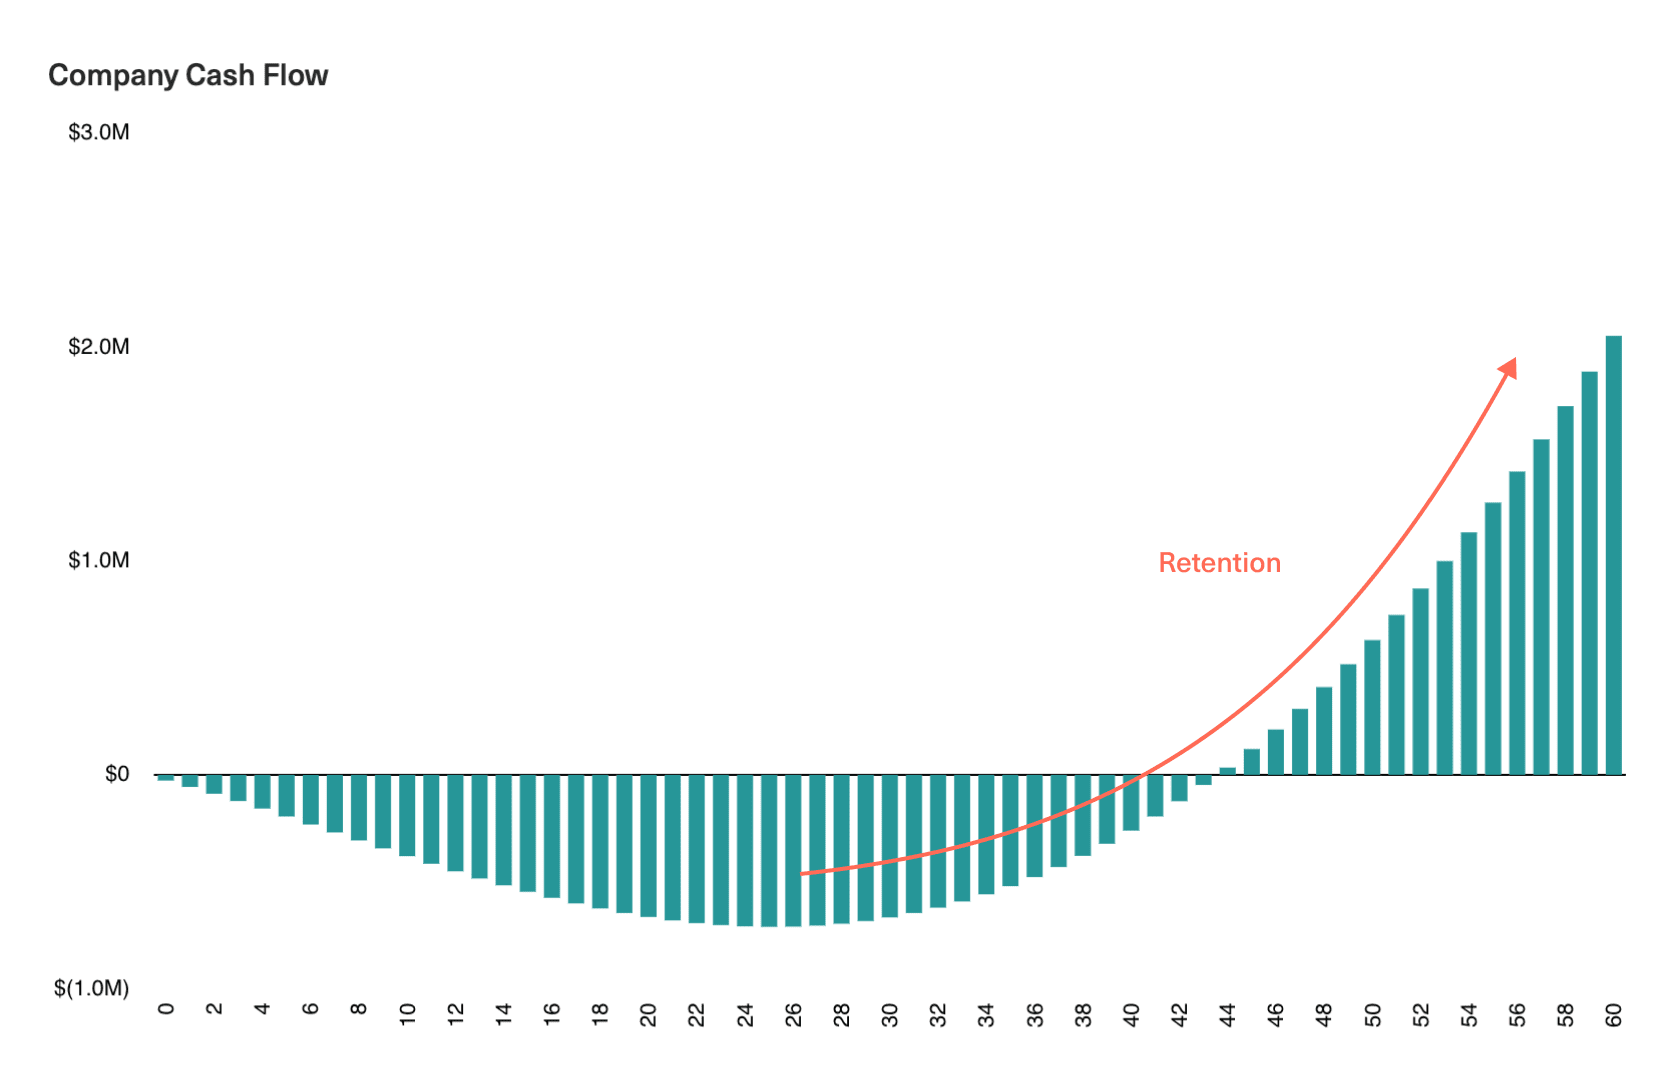
Taking a look at a given company’s cash flow over time, this is a crucial lever for determining the degree to which it retains revenue between time periods and, by extension, how quickly it recovers upfront customer acquisition costs. This ultimately determines the speed at which the company will enter the zone of profitability.
There are a few ways to interpret your cohorts to shed light on the underlying retention dynamics in your customer base.
First, consider how retention compares across cohorts at fixed age intervals. Are newer cohorts retaining worse, the same, or better than older cohorts at month 3/6/9? This will tell you if the stickiness of your customer base is changing over time, which could come down to shifts in product-market fit and/or changes in the quality of acquired customer cohorts.
Second, plot your cohorts to look at the slope of retention curves. This view will allow you to assess if the pace of retention is changing across cohorts based on changes made to the business. Let’s say you introduced annual contracts. This would likely increase upfront spend in more recent cohorts, which could result in less relative expansion at month 3. You might also see the retention lines converge by months 9-12 as churn from customers on month-to-month pricing drags down revenue from older cohorts.
Finally, remember that you can visualize cohorts differently based on what you’re seeking to understand.
Left-justfied
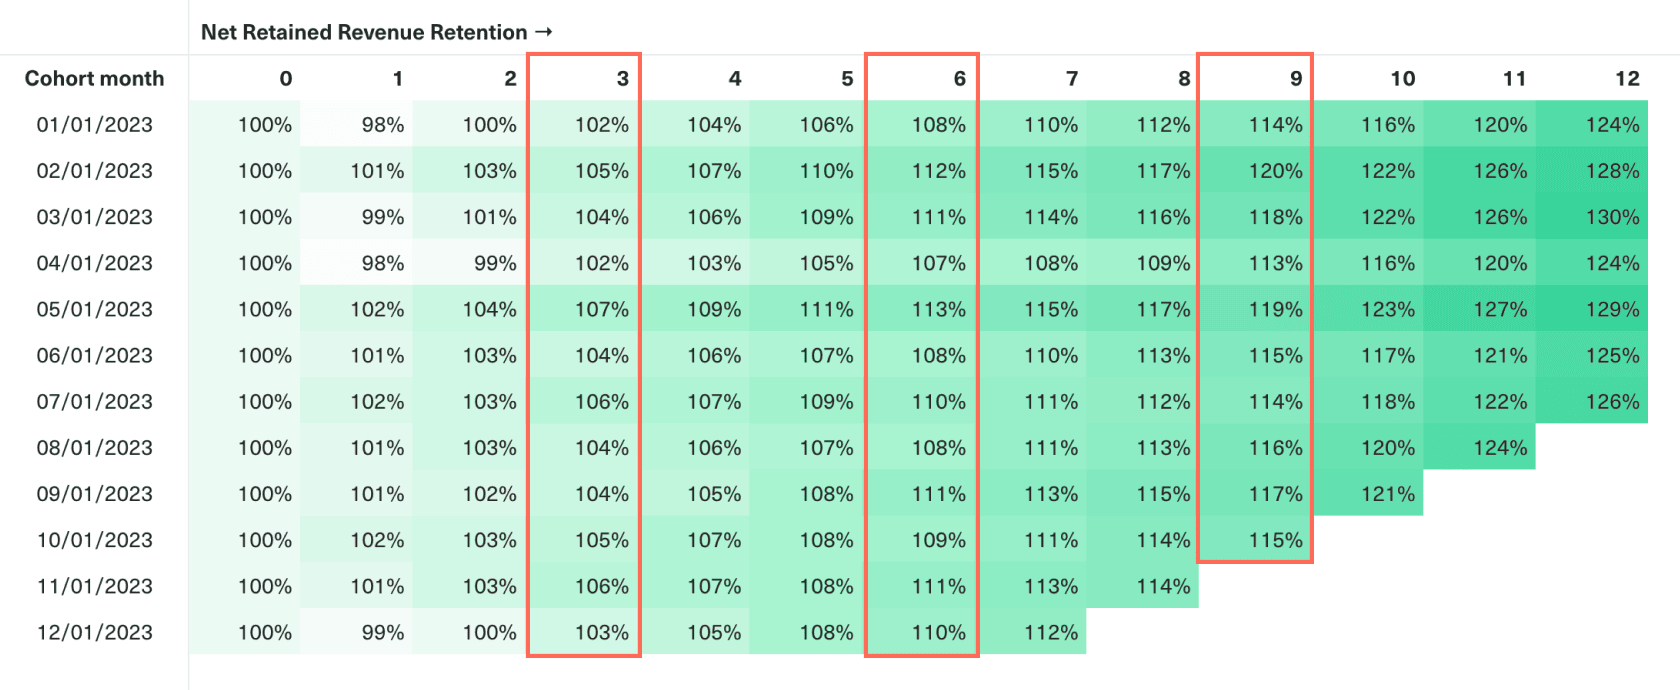
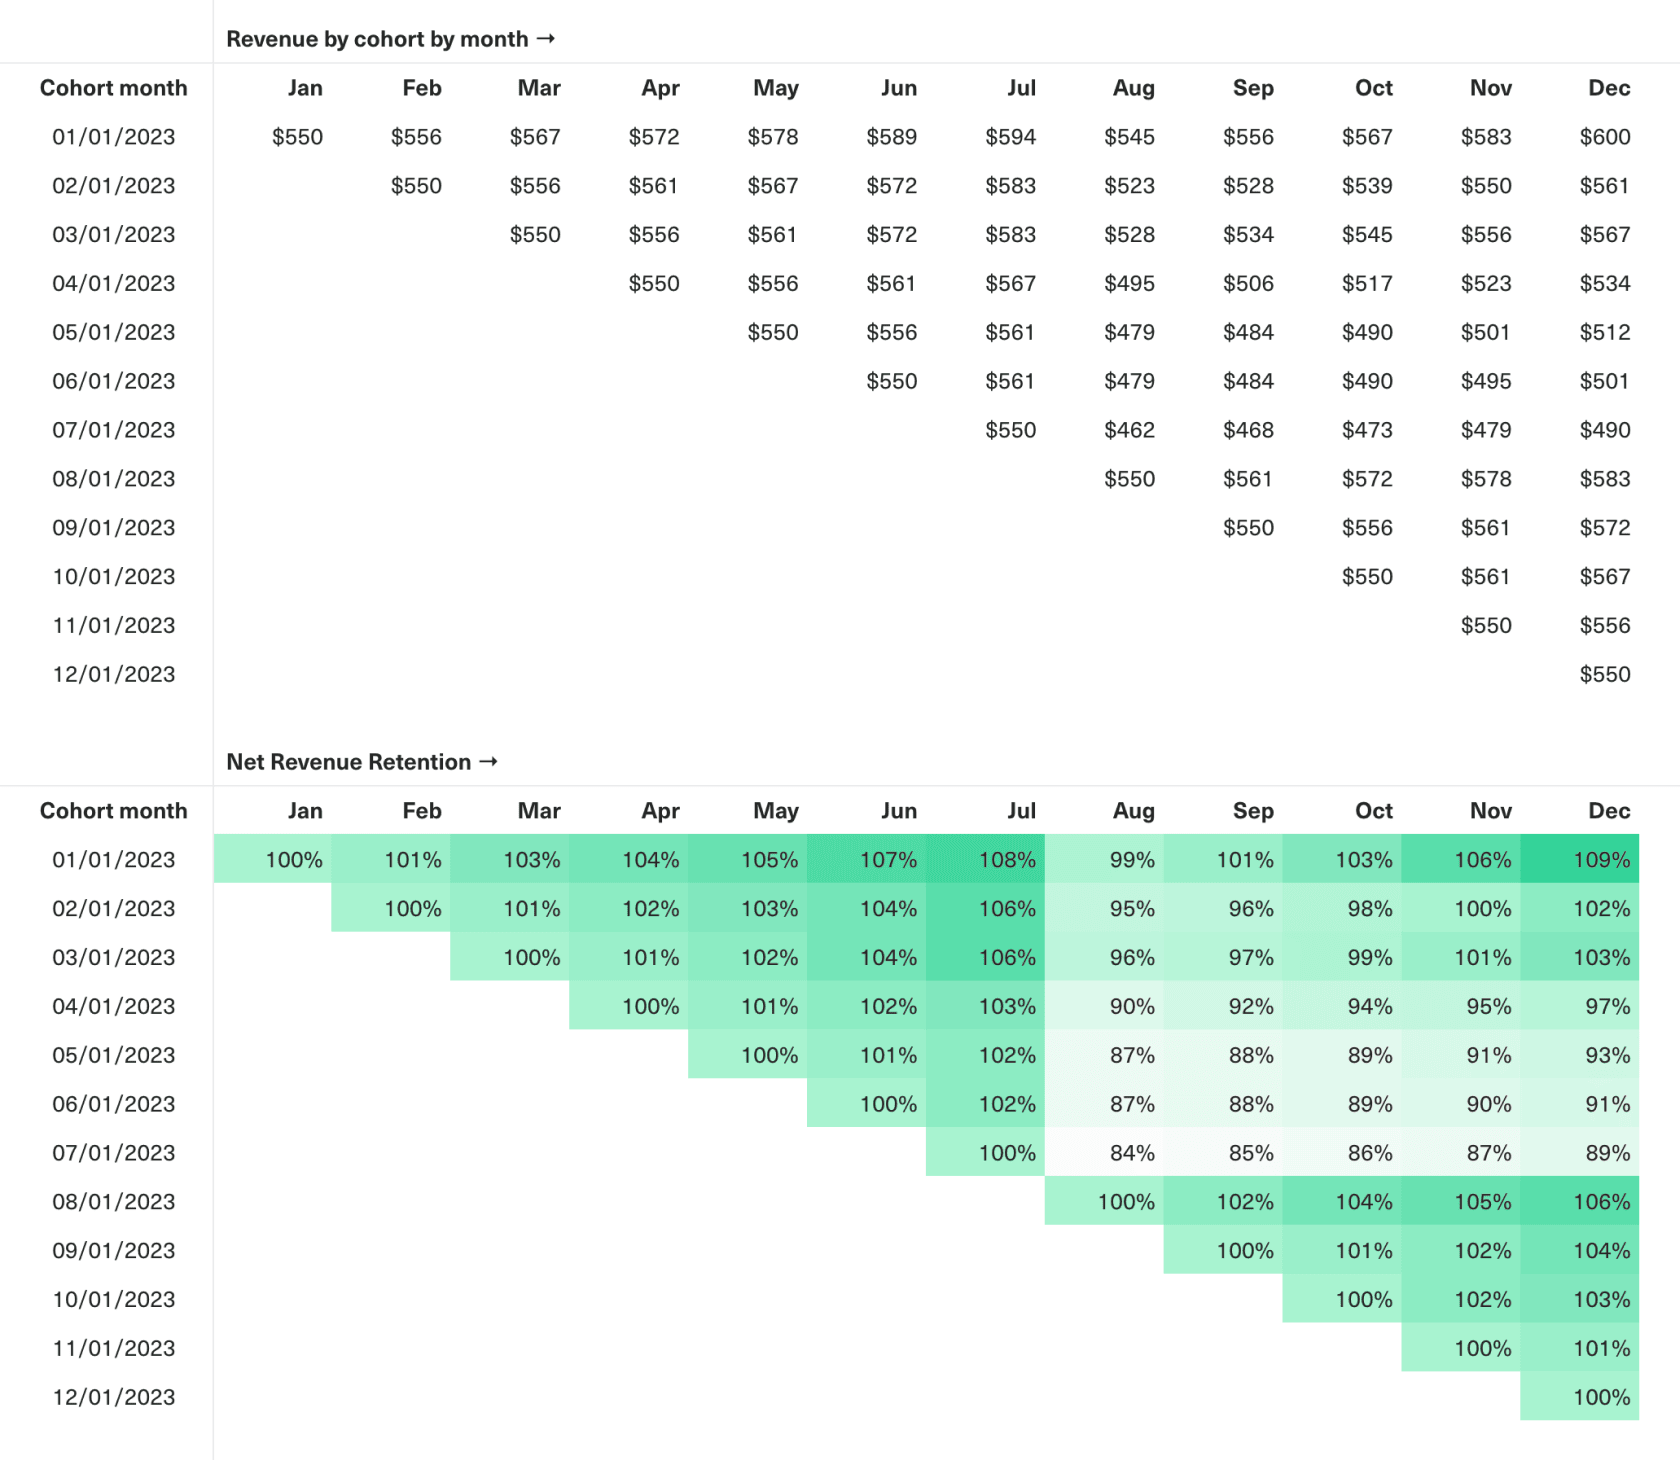
A left-justified view lines up cohorts based on their subscription start date (y-axis) and projects each cohort by month since acquisition (x-axis) such that you can easily compare cohorts at the same point in the customer lifecycle by looking down a column. This will allow you to benchmark customers based on their age and quickly assess the behavior of cohorts at different stages in the lifecycle relative to each other.
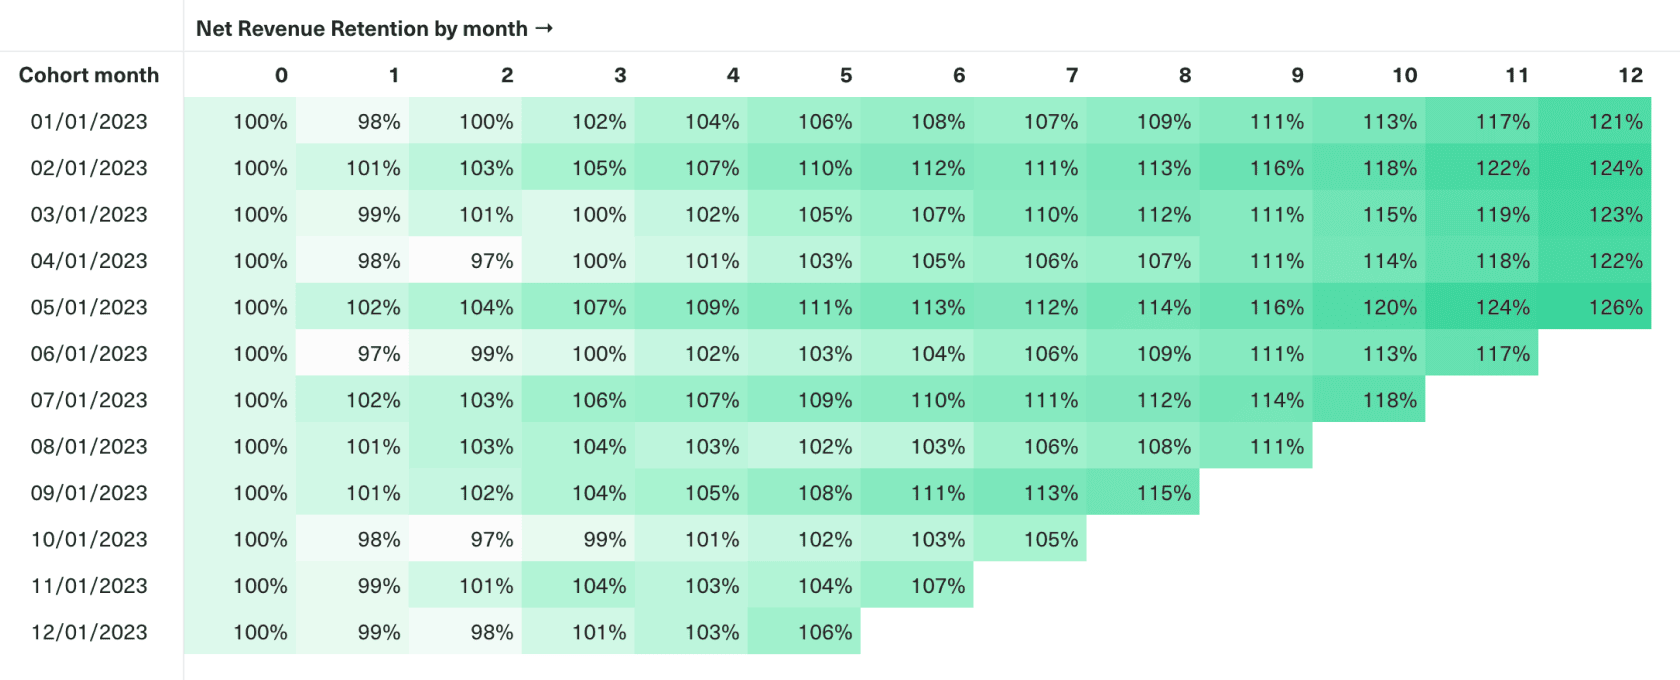
Right-justfied
By contrast, a right-justified view aligns customers based on calendar month (x-axis) rather than start date. This view will allow you to quickly diagnose changes that happened at a single point in time but that impact all cohorts. In the below example, you’ll see a drop-off in retention across cohorts in August due to a pricing change.
This view is also a great starting point for forecasting the business, as the sum of each column is the total revenue for that period.
How to calculate Cohorted Retention
We recommend monitoring multiple views of your cohorted retention to provide a comprehensive understanding of your churn dynamics. All of these start with building a cohort analysis, which tracks the behaviors of a group of customers acquired during the same period over time.
Logo Retention
This is a straightforward view of the percentage of initial customers from a specific cohort who are still considered active (i.e., those with an active subscription). It shows whether your customers are sticky and allows you to pinpoint where logo churn happens in the customer lifecycle.
Gross Revenue Retention
Complementary to Logo Retention, Gross Revenue Retention (also known as Gross Dollar Retention) assesses the percentage of original revenue retained from a given cohort over time, excluding any revenue from expansions. This is essentially a dollar-weighted average of logo retention that focuses purely on the erosion of initial spend from that cohort. This answers the question: Of all the revenue I started with from a given customer cohort, how much am I left with three months from now? A year?
Generally, you want to see Gross Revenue Retention in the 80-100% range. Anything lower, and you’ll likely have to keep filling the bucket with Gross New Revenue to offset spend erosion from contraction and churn.
Comparing your Gross Revenue and Logo Retention cohorts will also give you insight into whether churn is happening in the lower or higher end of your customer base. If Gross Revenue Churn is higher than Logo Churn for a given cohort and period, you can infer that larger, higher-value customers are leaving. Conversely, if Gross Revenue Churn is lower than Logo Churn, you know you’re losing smaller customers.
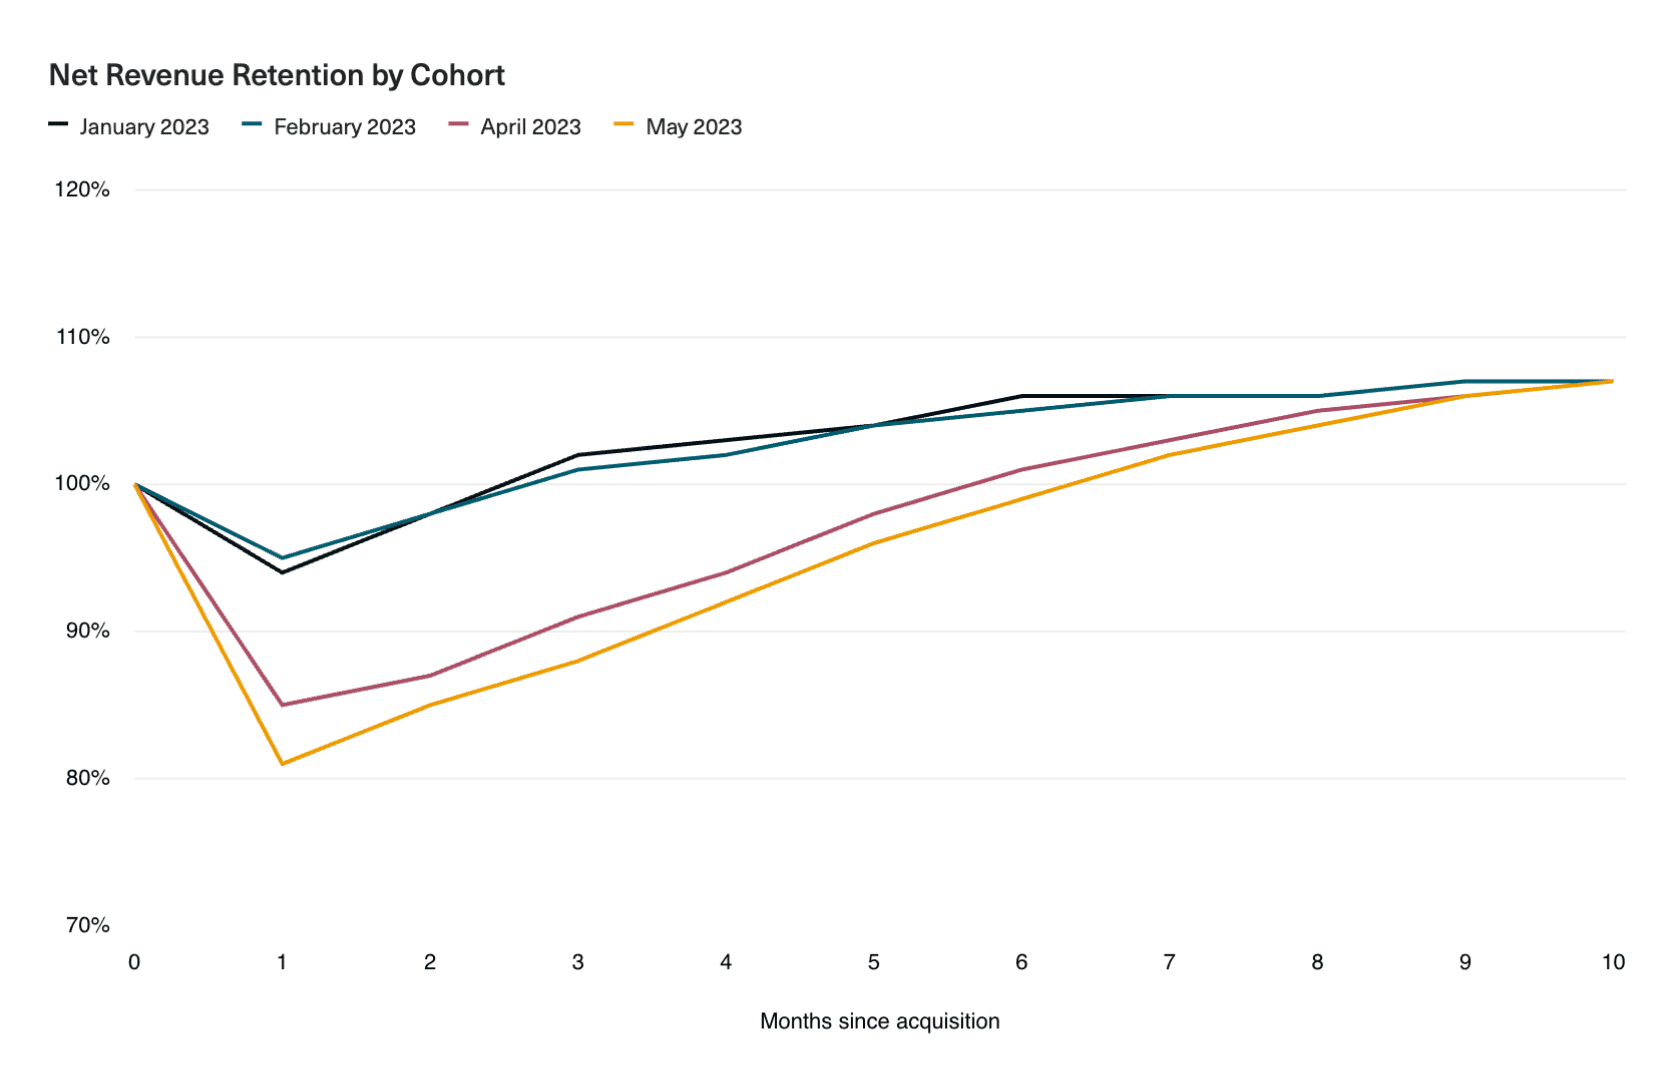
Net Revenue Retention
Net Revenue Retention (also known as Net Dollar Retention) provides a dynamic view of how total spend from a cohort of customers changes over time, accounting for the net impact of all revenue inflows and outflows. You’re essentially “following the money” by stamping the Gross New Revenue associated with a newly acquired customer cohort and evaluating how this revenue evolves across their lifecycle, including the impact of:
- Expansion revenue: Additional revenue generated from existing customers, including upgrades and add-ons, which increases total spend from a given cohort.
- Contraction revenue: Decreases in spending from customers downgrading plans or reducing usage.
- Churn revenue: Revenue lost when customers end their subscriptions and churn across their lifecycle.
In this way, we’re creating a comprehensive picture of the ongoing revenue contribution of a customer cohort over time. A positive Net Revenue Retention, where the total post-acquisition spend exceeds initial Gross New revenue, indicates a business model that benefits from strong customer loyalty and effective upselling. A negative Net Revenue Retention indicates that losses from churn and contractions outweigh gains from expansions, suggesting that customers may not perceive enough value in your product to justify paying. This could point to issues with product-market fit, pricing, or acquisition strategy.
How to optimize Cohorted Retention
By cohorting retention, you can make educated guesses about the sources of churn and make plans to address them. Are you seeing customers drop off early in the lifecycle, suggesting you need to improve onboarding and activation? Or are long-term customers churning, suggesting your product is not evolving in line with their more sophisticated needs? Alternatively, are new cohorts retaining at a lower rate than existing ones, indicating you may need to revisit your go-to-market strategy? Understanding these dynamics will help you prioritize where to target retention efforts.
Refer to Churn for a detailed breakdown of tactics to improve retention.
Next topic