The Ultimate
Guide to ARR
The Ultimate
Guide to ARR
Table of Contents
- Genesis
- Introduction to ARR
- ARR as your North Star
- Components of ARR
- Cohorting ARR
- Defining ARR
- Building ARR
- Acting on ARR
- Benchmarking ARR
- Taking Control of ARR
Find the levers to grow faster →
GTM analytics that shows you what's working — and what's not.
The Final ARR table
- By
-
 Chris Burgner
Chris Burgner
Chris Burgner
12+ years of experience, most recently as a Director of Finance at Intercom.

With the Padded ARR table in place, you have the foundation to calculate Net New ARR. This is derived by taking the ARR on any given date and subtracting it from the ARR on the prior date. The easiest way to derive this is through the LAG function in SQL:
annualized_amount - COALESCE(LAG(annualized_amount,1) OVER (PARTITION BY customer_id ORDER BY date ASC),0) as net_new_arrOnce Net New ARR is calculated, you can start dropping these values into each ARR component part’s calculation depending on:
- Where you’ve drawn the line for counting a customer
- The state of the customer at the time of Net New ARR
Here are some examples of how to think about this:
,SUM(CASE WHEN subscription_cancelled_at IS NULL AND invoice_number = 1 AND net_new_arr > 0 THEN net_new_arr
          ELSE 0 END) AS gross_new_arr
,SUM(CASE WHEN subscription_cancelled_at IS NULL AND invoice_number > 1 AND net_new_arr > 0 THEN net_new_arr
          ELSE 0 END) AS expansion_arr
,SUM(CASE WHEN subscription_cancelled_at IS NULL AND invoice_number > 1 AND net_new_arr < 0 THEN net_new_arr
          ELSE 0 END) AS contraction_arr
,SUM(CASE WHEN subscription_cancelled_at IS NULL AND invoice_number > 1 AND subscription_id_lag <> subscription_id THEN total_arr
          ELSE 0 END) AS restart_arr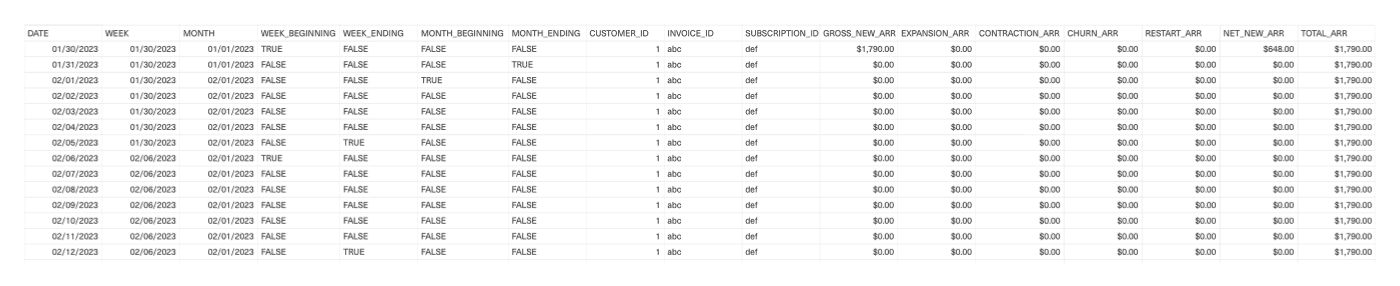
,SUM(CASE WHEN date = subscription_cancelled_at THEN annualized_amount_lag * -1 ELSE 0 END) AS churn_arrData output
The Final ARR table brings everything together on a per-customer, per-day basis and can easily be aggregated from there. Here’s how it should look:
Incorporating additional datasets
With the ARR Build complete, you may consider bringing in other datasets to join against the Final ARR table for other reporting needs, such as product usage, customer acquisition, and firmographic data.
The most efficient way to do this is to establish separate, modular groupings of data and eventually join those together in one large “Comprehensive” ARR table. Under this structure, modular data sets are grouped together when they share a similar classification or upstream data source.
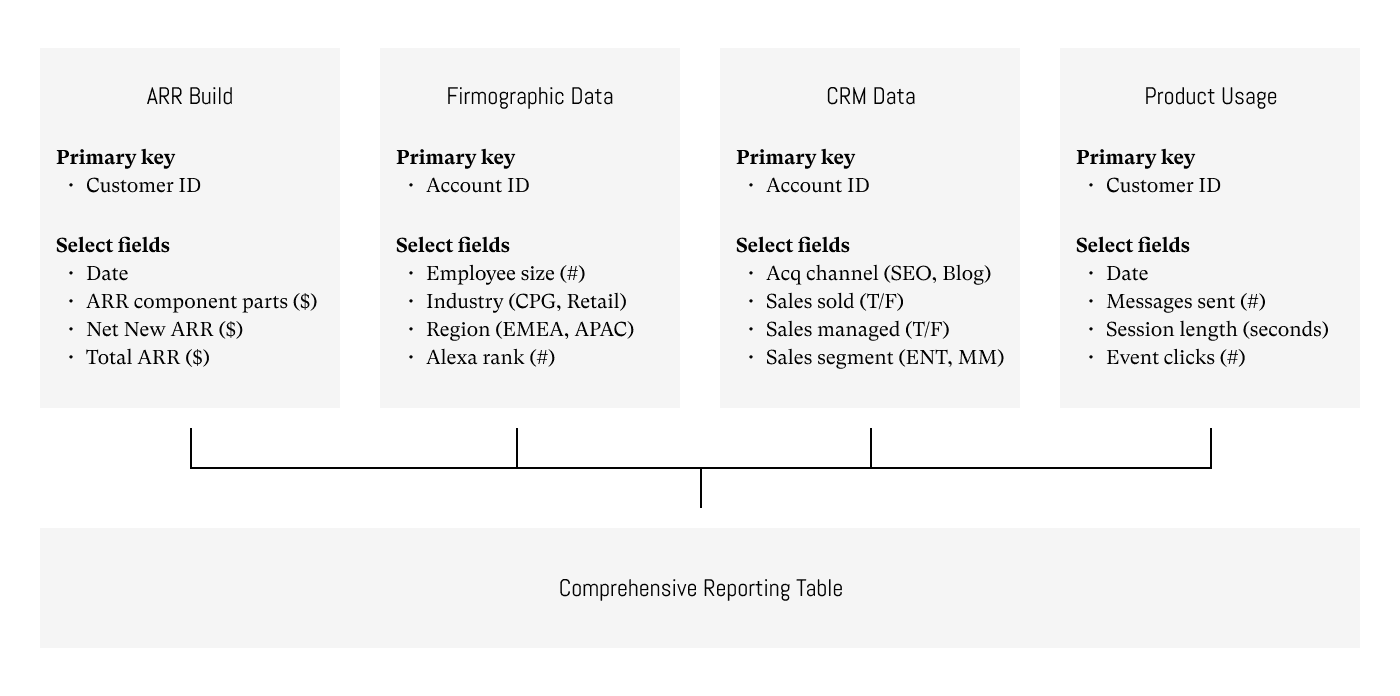
There are a few advantages to organizing your data like this:
- You create a one-stop-shop table. This single table can handle ~90% of your reporting, from board decks to go-to-market updates.
- You simplify the SQL writing. Creating modular datasets creates a single source of truth, rather than rewriting it each time you want to query the data. Also, updating logic happens in one location and automatically flows through to your downstream sources.
- You gain a lot of efficiency in debugging and comprehension. The rest of the team can get up to speed on your ARR table more quickly, introducing redundancy and better data comprehension.
Here’s every field we ended up with in our table at Intercom:
| ARR Time Series | |
|---|---|
| Gross New | A unique identifier for each ARR instance that is easily linked to other data sets |
| Day | Run every column on this table for every account_id daily |
| Customer Start Date | As defined in your business logic, the day this customer became a paying customer |
| Customer Cancel Date | As defined in business logic, the day this customer churned |
| Price plan/product name | Some indication for the plan or product this customer has on that day |
| Contract type | e.g. Multi-year, annual, semi-annual, quarterly, monthly |
| Payment terms | e.g. Multi-year upfront, annual upfront, semi-annual, quarterly, monthly |
| Most recent invoice amount | Amount paid on last invoice |
| ARR amount | ARR amount as defined by business logic (e.g. taking into consideration discounts, ramping, usage, overages, underages, etc.) |
| Gross New ARR | Gross new ARR amount relative to day -1 |
| Expansion ARR | Expansion ARR amount relative to day -1 |
| Contraction ARR | Contraction ARR amount relative to day -1 |
| Churned ARR | Churned ARR amount relative to day -1 |
| Net New ARR | Net New ARR amount relative to day -1 |
| Month start date | Start date for the month |
| Month end date | End date for the month |
| Month beginning | True / False |
| Month ending | True / False |
| Quarter start date | Start date for the quarter |
| Quarter end date | End date for the quarter |
| Quarter beginning | True / False |
| Quarter ending | True / False |
| Fiscal year start date | Start date for the fiscal year |
| Fiscal year end date | End date for the fiscal year |
| Fiscal year beginning | True / False |
| Fiscal year ending | True / False |
Next topic