The Ultimate
Guide to ARR
The Ultimate
Guide to ARR
Table of Contents
- Genesis
- Introduction to ARR
- ARR as your North Star
- Components of ARR
- Cohorting ARR
- Defining ARR
- Building ARR
- Acting on ARR
- Benchmarking ARR
- Taking Control of ARR
Find the levers to grow faster →
GTM analytics that shows you what's working — and what's not.
Acting on ARR
- By
-
 Bobby Pinero
Bobby Pinero
Bobby Pinero
15+ years of corporate finance experience, currently co-founder at Equals and board member at Intercom.

One simple report changed the trajectory of Intercom. Interestingly, there were no insights or opinions to be found in the report. The Daily Pulse was an auto-generated email with simple graphs sent out to everyone in the company every day at 5 pm PST, summarizing our business that day. To say the metrics were simple would be an overstatement. It’s about as basic as reporting gets, mostly centered around ARR.
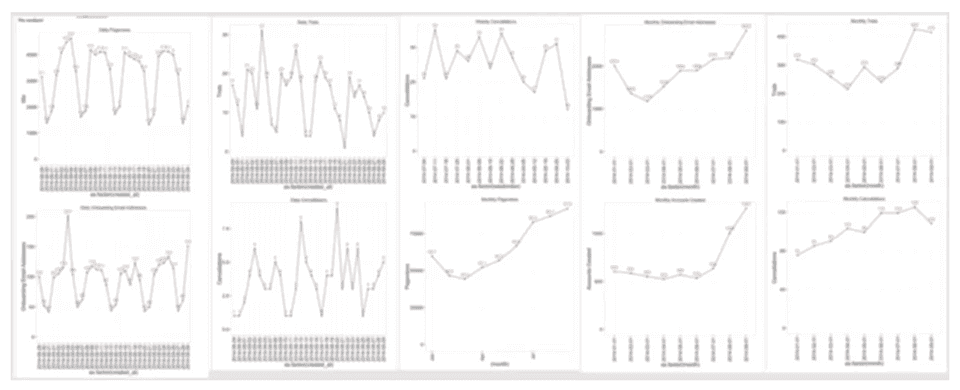
The charts were: Daily Page Views, Daily Onboarding Emails, Daily App Installs, Daily Trials, Daily Cancellations, Daily Gross New, Expansion, Contraction, and Churned ARR–including weekly and monthly versions of each of those charts.
Ask any early Intercom employee and they’ll remember its impact. It did three things:
- Pushing metrics to every employee daily allowed everyone to own what we cared most about at the time - growth - which pervaded decision-making across the entire company.
- It forced a check in every single day. You better believe that if something looked funny at the end of the day there was a reply-all from our CEO, Eoghan, or one of our function heads. We were all on the hook to chase down answers within 24 hours, which drove extreme accountability.
- We had incredibly fast feedback loops. Launch something on Product Hunt? Introduce a new screen in onboarding? Break some instrumentation in the funnel? You would see early indicators of the impact the same or the next day.
This fundamentally changed the culture of the company and how people engaged with data.
The Daily Pulse is an example of how operationalizing metrics matters almost more than the metrics themselves. We had ARR reporting set up before that, but it wasn’t until we started pushing it to people daily that folks understood it, built an intuition about it, and could connect the dots between their work and how it moved (or did not move) the needle.
Most finance folks spend an inordinate amount of time setting up the reporting and getting things correct but don’t spend enough time thinking through how to let others make the most of that information. In this chapter, we share a few principles to help with that.
Build a fast and consistent cadence for looking at metrics
Most of us organize our finances and pay bills monthly. Companies have board meetings and report quarterly. These are easy cycles to fall back to—even small startups that compete on speed fall back to reporting monthly or quarterly. A surefire way to create complacency around data is to fall back to these cadences.
Decisions are made daily—often multiple times a day, particularly in startups. You need a set of metrics that match the cadence at which you’re making decisions. As was the case with the Daily Pulse, we’ve found that looking at ARR metrics on a daily basis actually makes a difference.
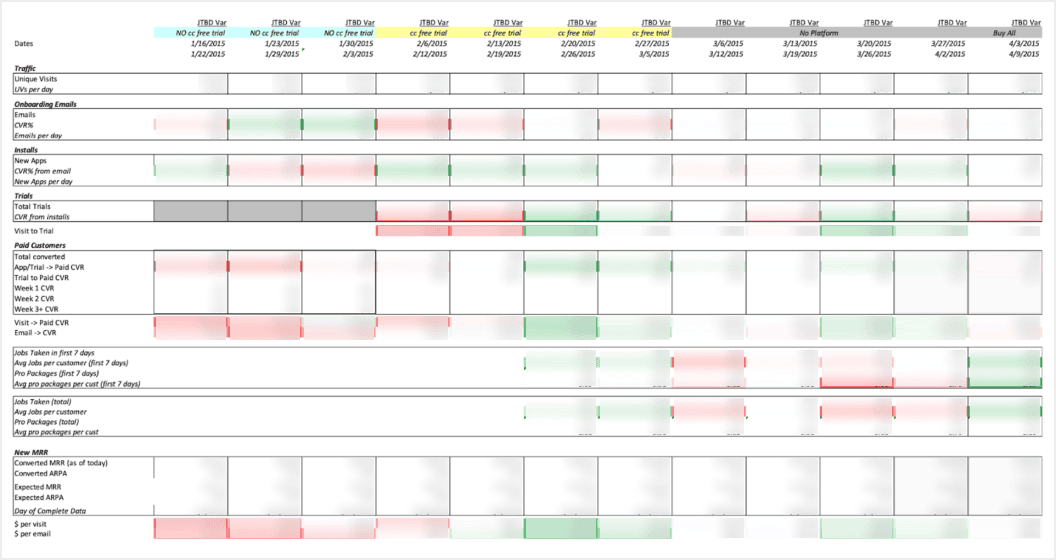
We’ve also found that having a weekly sync where you pull up on the high-level metrics across the business—which should include ARR, its component parts, a forecast, and cohorts—keeps everyone on the same page. Every week on Friday, we’d walk the entire exec team through the following:
- Every metric in our funnel
- The status of every ongoing experiment
- Our ARR Build, its parts, and a forecast
We did this every single Friday. It was a nightmare to put together—it’d take me all day to do—but it was incredibly impactful. Here’s a sample from one of the decks back then:
Deliver metrics where your team works
We build dashboards because we assume people will log in regularly to view them. But they don’t—people are lazy, busy, or both. No matter how important the dashboard or metric is, days are quickly consumed by meetings and never-ending to-do lists. Teammates will go weeks before logging in to view your beautiful dashboard.
The fastest way to change how data gets used in an organization is to deliver where people are already working, i.e., “The Daily Pulse”. Sending key reports and metrics daily via email or chat will quickly change your teams’ understanding of and ability to act on data.
Developing habits requires making small changes on a consistent basis. To make data habitually part of the conversation, force it to be part of someone’s every day.
Keep it stupid simple
If you send your team metrics, you must ensure they understand exactly what they are looking at. They should be able to articulate why they matter and how they’re calculated. Most people think this involves creating a data dictionary or a repository where the team can find the definition for every metric. But if that’s your solution the metrics are too complicated to start with. You should pick inherently simple metrics rather than spend time on detailed explanations.
For example, say you want your team to stay on top of Net Revenue Retention (NRR). It’s a quite complex metric that’s multifaceted and not widely understood. We filled many pages in this book covering it and could probably write another entire book on the topic! Most people in the business don’t really understand it. Alternatively, you might consider showing the team the actual number of customers who made it to X period trended over time or the amount of expansion/contraction dollars over time. Those are metrics everyone understands and feels empowered to act against.
Tie everything back to ARR
This is why we suggest starting with ARR as the centerpiece for your reporting. Every business question ultimately points back to the same thing: Is this a long-term profitable thing for us to do? Is there a measurable return on investment on some time horizon? The best way to make sure that every decision you make—and that every decision others make—meets those criteria is to tie as many things back to ARR as possible.
For example, if you’re trying to establish a user engagement metric, you don’t want to create that metric in a vacuum, devoid of any consideration for the impact it might have on the broader business. You want to create that metric by determining what type or level of engagement correlates well with a customer who’s either more likely to pay you (Gross New), pay you more (Expansion), or pay you for longer (Retention). From there, you’ve established a connection between that engagement metric and why it matters to you (ARR).
Play great defense
We’ll share another story that one of our early mentors shared. Ray Ko was the head of Analytics and Growth at Facebook in the early days. He was in charge of understanding Facebook’s core metric—MAU (Monthly Active Users)—and why it grew. He built the systems that supported it, and since his Facebook days, he’s gone on to advise many other top Growth teams in the valley. He has a thesis that growth is actually unlocked by playing great defense in your business. What does that mean? Well, this is his story.
We love this lesson because it speaks to the importance of setting up a great system. That system is what lets you play great defense. You can play great defense by building a system that gives you clear visibility into your ARR and business processes—consistently and at scale. The question then becomes how can you take that defense and turn it into great offense? What’s the equivalent in your business for confirmation emails, and how can you not just fix the problem but turn it into an opportunity to grow?
Next topic